
In today’s climate of escalating weather volatility and increasing scrutiny from insurance carriers, the difference between a dismissed claim and a successful recovery often comes down to one central question: can you prove what the atmosphere was doing at a specific property, on a specific date, at a specific time? That is where Praedictix’s forensic meteorologists become indispensable allies. In a market defined by obfuscation, delay, and deflection, our forensic meteorology team delivers the specificity, objectivity, and scientific rigor needed to support coverage determinations and secure fair outcomes for your clients, grounded in established meteorological best practices.
- Our forensic meteorologists analyze the best available meteorological data, including Doppler radar, satellite imagery, and verified surface and upper-air observations, to objectively reconstruct atmospheric conditions relevant to the loss.
- The role of a forensic meteorologist is not simply to state that a storm occurred, but to demonstrate how and why specific atmospheric processes caused the observed damage—for example, wind shear contributing to roof failure, microburst-driven outflow winds toppling trees, or hailstone characteristics correlating with impact patterns on roofing and siding.
- This level of scientific detail equips attorneys with defensible, data-driven evidence capable of withstanding rigorous scrutiny in court or arbitration. For homeowners and businesses, it converts anecdotal loss narratives into objectively verifiable facts. For counsel, it fortifies causation arguments, challenges insurer denials, and brings clarity where uncertainty once prevailed.
How Forensic Meteorologists Prove the Date of Loss
One of the most persistent challenges in weather-related claims is not whether damaging weather occurred, but whether that damage can be conclusively tied to a specific property on a specific date. As severe weather events become more frequent and intense, insurers face increasing exposure and, in response, apply heightened scrutiny to claims involving wind and hail. Disputes often arise when carriers attribute observed damage to long-term wear, gradual deterioration, or a prior weather event outside the policy period. In these cases, the issue distills to a single, critical question: can the alleged damage be scientifically linked to the reported Date of Loss? This is where forensic meteorologists become essential rather than optional. By applying a scientific chain of custody to atmospheric conditions, forensic meteorologists determine whether qualifying weather hazards were present at the precise location and time in question. Using hyper-local radar, satellite, and surface observations, they reconstruct a defensible timeline that places relevant atmospheric forces directly over the insured property.
The outcome is a shift from conjecture to substantiation, replacing uncertainty with data-driven conclusions that clearly establish when damage did or did not occur.
Advanced Doppler Radar: Moving Beyond Consumer-level Data
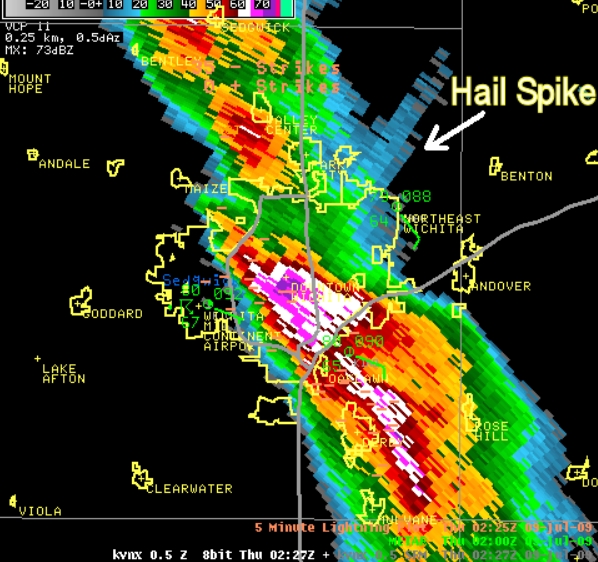
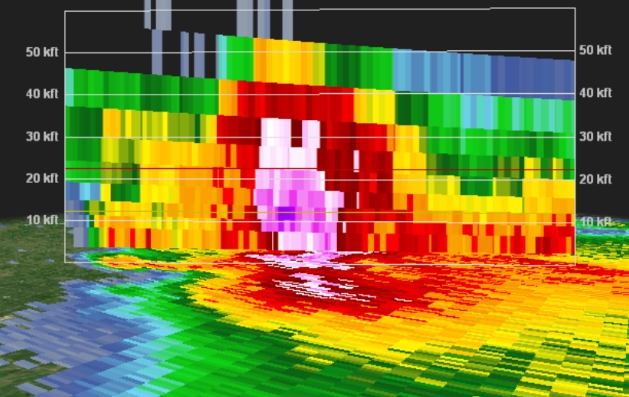
Most consumer weather applications reduce radar data to simple color displays that indicate relative precipitation intensity. While useful for general awareness, these products lack the resolution and diagnostic capability required for forensic analysis. Forensic meteorologists at Praedictix have access to more than just basic radar products. For example, access to advanced Dual-Polarization (Dual-Pol) Doppler radar data, made available through the nationwide NEXRAD network upgrade, helps analyze the physical characteristics of precipitation and the processes occurring within a storm. These tools allow us to evaluate not just whether precipitation was present, but what type, how intense, and how likely it was to cause damage at a specific location. Key Dual-Pol products include:
- Differential Reflectivity (ZDR)
Provides insight into the shape and orientation of hydrometeors, helping distinguish between rain, hail, and mixed precipitation. - Correlation Coefficient (CC)
Measures the uniformity of targets within the radar sampling volume. Lower values are associated with mixed or irregular targets, such as tumbling hailstones or wind-driven debris, offering critical context in both hail and high-wind events. - Maximum Expected Size of Hail (MESH)
Used to assess the potential size of hail aloft. When combined with volumetric radar analysis and ground observations, MESH supports property-specific hail swath mapping that can establish whether damaging hail sizes were plausible at the insured location.
Together, these datasets allow forensic meteorologists to move beyond generalized storm descriptions and toward a defensible assessment of whether damaging weather conditions were present over a specific property during the claimed loss window.
The “Wear and Tear” Argument
When an insurance carrier asserts that observed damage is old or the result of long-term deterioration, forensic meteorologists are able to provide a data-driven rebuttal through historical storm analysis.
- The Exclusionary Method: If a carrier argues that damage originated from a prior event, such as a storm in 2018 rather than the claimed 2024 Date of Loss, a forensic meteorologist can analyze weather conditions impacting the property over an extended historical period. If the data show that hail exceeding 1.5 inches at the exact latitude and longitude of the property occurred only on the reported Date of Loss, the argument for pre-existing damage loses scientific support.
- Wind Load Analysis: For commercial structures where siding, roofing, or exterior components have been displaced, forensic meteorologists evaluate wind velocity data to determine whether wind speeds exceeded the material’s ASTM-rated performance thresholds on the date in question. When wind forces meet or exceed those design limits, the damage mechanism can be directly tied to a qualifying weather event rather than gradual wear.
The Data: Why Extreme Weather Claims Are Skyrocketing
You may ask whether extreme weather events are truly increasing. The data-driven answer is unequivocal: yes.
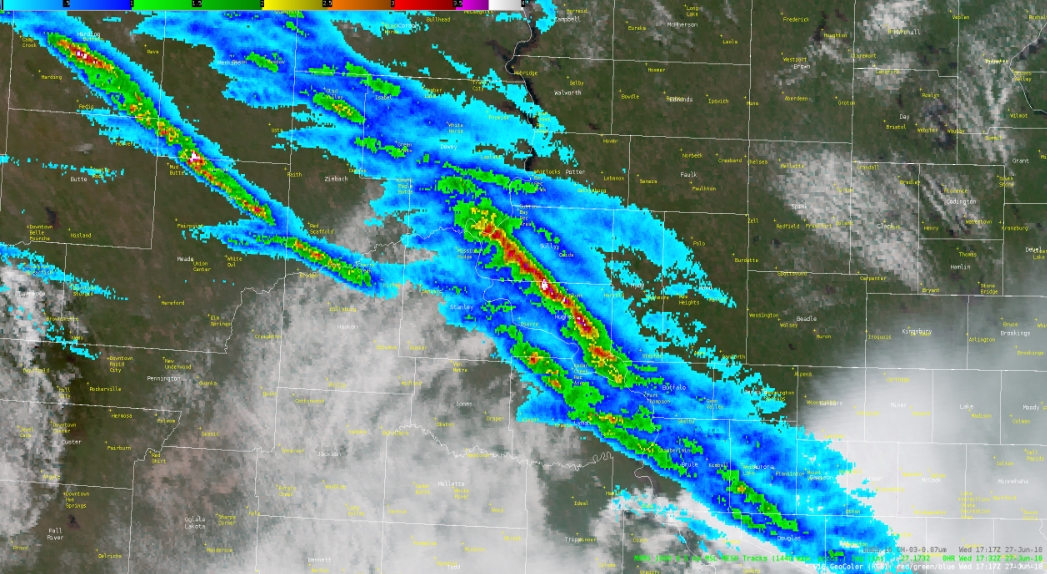
The United States accounts for a disproportionate share of global weather-related insurance losses. This concentration is driven by a convergence of factors, including high property values, widespread insurance coverage, and a geography uniquely susceptible to severe convective storms such as hail and tornadoes, as well as hurricanes. As a result, the U.S. experiences more high-impact, weather-driven loss events than any other country.
Geography plays a critical role. The absence of a significant east–west mountain barrier allows cold, dry air from the north to collide with warm, moist air from the south, creating an efficient engine for severe weather. At the same time, ongoing development and suburban expansion into formerly rural areas have increased exposure, placing more people and higher-value assets directly in the path of these hazards. The outcome is not merely more storms, but more claims.
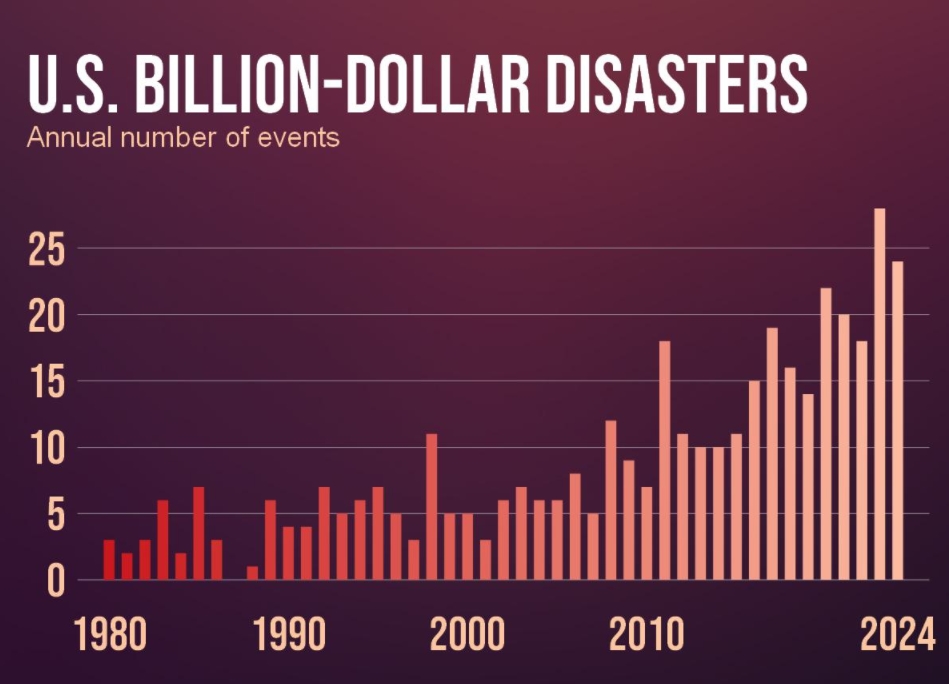
Credit: NOAA, Climate Central
The Rise of the Billion-Dollar Storm.
The United States currently leads the world in property insurance claims due to extreme weather, accounting for 65% to 80% of all global insured losses.
- Flooding. Flood damages have shifted from predictable river-basin events to catastrophic urban flash floods. In the 1980s/90s, flood damage averaged $4-5 billion annually. In the last decade this has spiked to $15–17 billion annually, driven by rain bombs (extreme precipitation events) hitting paved urban areas that cannot drain quickly or efficiently.
- Hurricanes. The costliest weather risk of all. In the 1980s, the U.S. averaged roughly $20 billion (adjusted) in hurricane losses, per decade. In the 2010s that number exploded to over $400 billion, per decade. Due to consistently warmer ocean water (which fuels hurricane intensity) we are seeing “rapid intensification” of hurricanes before landfall that leave little time to prepare.
- Wildfires. This is the most staggering percentage increase. In the 1980s, wildfire damage was negligible on the national scale (often less than $1 billion/year. Since 2017 the U.S. has seen multiple years with wildfire damage exceeding $16-20 billion annually. What is causing this spike? A combination of hotter/drier drought cycles and the Wildland-Urban Interface (WUI). Demographics play a big part in this: people are moving into high-risk forest zones in California, Colorado, and Oregon.
- Tornadoes and Severe Thunderstorms. Financial losses from Severe Convective Storms (SCS)—the category encompassing tornadoes, hail, and straight-line winds—have increased by 591% (nearly 6x) when comparing the 1980–2005 average to the 2006–2018 average.
The “Expanding Bullseye” of Hail Damage.
The number of billion-dollar severe hailstorm events across the U.S. has jumped from an average of 2 per year (1980s) to 19 per year (in the last 5 years).
- Data suggests that much of the increase in hail reports and hail damage is self-inflicted. Since 1980, the developed land area in the United States has increased by more than 50%. Hail researchers Walker Ashley and Stephen Strader (who study severe convective storms at Northern Illinois University/Villanova) produced research confirming that the target (the built environment: all these new homes, subdivisions, shops, etc.) is expanding much faster than the hazard (the hailstorm).
- Location. Location. Location. All this new development and expansion didn’t happen randomly; it has taken place disproportionately across Hail Alley. The fastest-growing metro areas in the US over the last 30 years—Dallas-Fort Worth, Denver, San Antonio, Austin—sit directly in the climatological bullseye for severe hail. There are simply more homes, stores and businesses in the path of the severe hailstorms that have been flaring up since Earth had an atmosphere.
Why Is Repairing Hail Damage Becoming More Expensive? A number of factors are in play here. The bottom line: over time we have made our homes significantly more expensive to repair from weather-related damage.
- Roof Complexity. In the 1980s, a standard roof was a simple gable with asphalt shingles. Today, McMansions feature complex hip roofs, turrets, and valleys. This increases labor costs.
- Materials: We have moved from basic 3-tab shingles to architectural shingles, and increasingly to metal or synthetic materials which are more expensive to replace.
- Accessories: A roof in 1990 was just a roof. A roof in 2024 has solar panels, skylights, and sometimes satellite hardware. A hailstorm now destroys a power plant (solar), not just a water barrier.
- Inflation: According to Verisk and Xactware data, roofing material and labor costs have outpaced the CPI (Consumer Price Index) significantly over the last decade.
What are the Top States for Insurance Loss (in Dollars) from Severe Hailstorms? Here are the states with the most hail activity and financial losses in recent years (2022–2024). It is important to distinguish between Hail Reports (meteorological frequency) and Hail Losses (financial severity). A state like Kansas gets immense amounts of hail (frequency), but because it is less densely populated than Texas or Illinois, its total dollar loss is often lower.
- Texas: Consistently the most expensive state. In recent years, Texas has averaged over $500 million to $800 million in annual hail claim payouts from major carriers alone.
- Colorado: Often ranks #1 in “per capita” loss. The Denver metro area is in a direct hail path, meaning a single storm often causes >$1 billion in damage.
- 3. Minnesota: In 2022/2023, Minnesota claimed the top spot for State Farm’s hail payouts (over $799 million in one year), surpassing even Texas due to a relentless series of storms hitting Minneapolis suburbs.
- 4. Illinois: High density in Chicago’s suburbs means storms here are incredibly costly.
- 5. Nebraska: While lower in total population, the frequency of storms here is so high
that total losses rival much larger states.
What is The Reporting Bias (“Smartphone Effect”)
We are seeing a massive uptick in hail reports, but this is partly artificial. Put at least some of the blame
on the smartphone in your pocket. Why?
- 1980s: Hail fell in a field. Unless a farmer reported it to the NWS (fairly rare), it didn’t exist in the database.
- 2020s: Hail falls in a suburb. 500 people tweet pictures of it, and 50 storm chasers stream it live. The NWS verifies it.
- The increase in hail reports is partly a function of population density. We are simply there to see it now and take pictures and videos with our phones.
- A primary driver of an exponential rise in hail insurance losses is Reporting Bias and an Expanding Bullseye Effect, which also resonates with many flooding/hurricane losses, even “flash
freezes” in Texas in recent years. We have aggressively built our most expensive assets—sprawling subdivisions and commercial centers—directly in the migration path of historical severe weather patterns. Put another way for soccer or hockey fans: we are playing goalie with a much wider net.
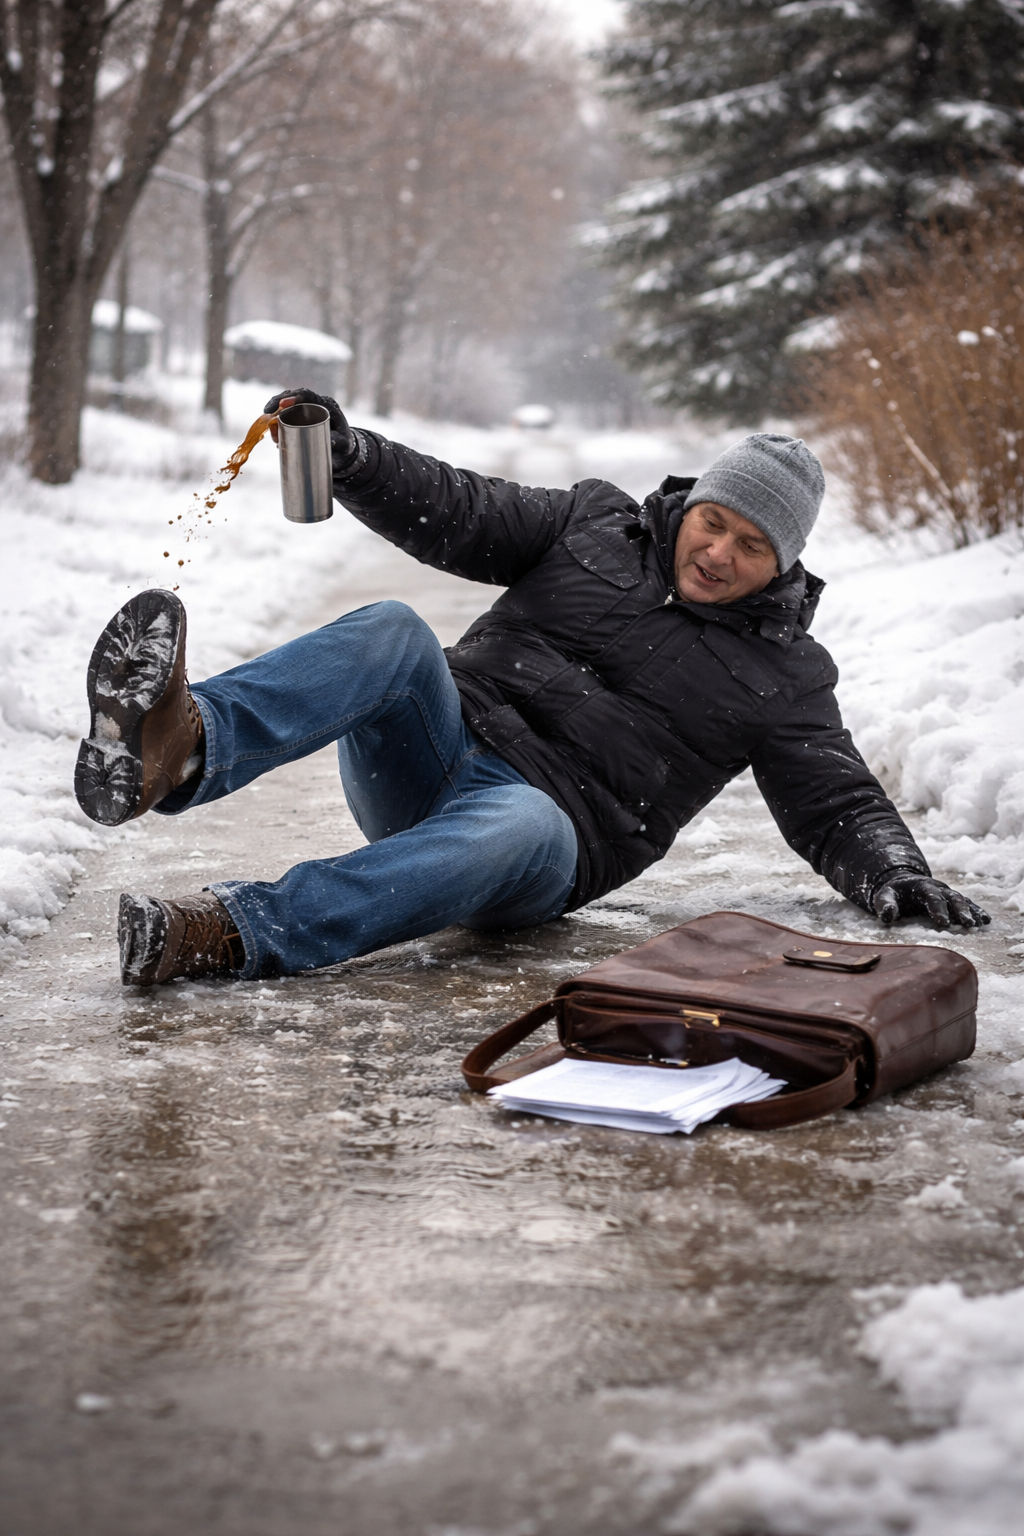
Why are We Seeing More “Slip and Fall” Winter Injuries Across the US?
Statistics on slip-and-fall accidents specifically tied to ice and snow reveal a clear upward trend, driven by two compounding factors: an aging population (demographics) and increasingly volatile winter weather patterns. Research suggests that we are seeing fewer all-snow winter storms and more mixed rain, snow and ice events from the Midwest and Ohio Valley into New England and the Mid-Atlantic states, creating conditions ripe for “black ice”. How big is the problem? Every year in the US, winter weather creates a massive baseline of injury and liability:
- 1 Million Injuries: Approximately 1 million Americans are injured annually due to slips and falls on ice and snow, a calculation derived from reliable, official U.S. injury surveillance data.
- 17,000 Fatalities: Surprisingly, the CDC reports that falls are a leading cause of accidental death, and roughly 17,000 of these fatal falls occur annually in situations involving snow or ice.
- Workplace Impact: According to BLS data, there are over 42,000 workplace injuries annually attributed specifically to ice, sleet, or snow that require days off work.
- The “Monday Morning” Spike: Insurance data shows that claims spike on Monday mornings following weekend storms, as businesses reopen with uncleared lots.
- People are Living Longer: From 1999 to 2020, the age-adjusted rate of deaths from falls among adults over 65 more than doubled, rising from 29 per 100,000 to 69 per 100,000.
- As the US population ages, a slip on ice that might have been a bruise in 1985 is now a hip fracture or traumatic brain injury (TBI) in 2024. This drives the severity and cost of insurance claims much higher.
- Proving liability in these cases often hinges on establishing a melt-refreeze timeline. Praedictix forensic experts analyze minute-by-minute temperature and precipitation data to determine if ice was present at the exact moment of the fall, refuting claims of negligence.
The Bottom Line: Science is the Only Antidote to Ambiguity
We are operating in an era of an expanding bullseye, where extreme weather is not only becoming more volatile but increasingly striking the most valuable assets on the landscape, including dense residential developments and commercial centers. As exposure grows, so do losses. In response to record-setting weather-related payouts, including tens of billions of dollars from severe storms in recent years, insurance carriers have adjusted their approach. The focus has shifted from broad protection toward loss preservation, with greater reliance on ambiguity-based defenses that characterize damage as cosmetic, pre-existing, or unrelated to the reported event. In this environment, objective science becomes essential. Forensic meteorologists replace assumption with evidence, clarifying when, where, and how damaging weather occurred. When ambiguity is used as a strategy, defensible data is the only effective countermeasure.
Our Role as Forensic Meteorologists
In coverage disputes, uncertainty often determines the outcome. When a policyholder cannot establish precisely when and how damage occurred, coverage is frequently denied. Personal recollections or consumer weather applications rarely meet the evidentiary standard required in litigation or arbitration. This is where the Praedictix value proposition becomes clear. Forensic meteorologists establish a scientific chain of custody for weather events, applying Dual-Polarization radar analysis and hyper-local data reconstruction to determine whether damaging conditions were present at a specific location and time. Rather than relying on generalized statements such as “it may have hailed,” forensic meteorologists provide objective conclusions regarding hail size, directionality, timing, and duration—each supported by validated meteorological data. For attorneys, property owners, and businesses, forensic meteorology is no longer an ancillary service. It is a critical tool for clarifying causation, resolving disputes, and ensuring that coverage determinations are grounded in defensible science rather than ambiguity.
Ready to Build Your Case? The team of forensic meteorologists at Praedictix is happy to get on a complimentary call to review your case. Let us help you connect the dots and secure a positive outcome for your clients.
About the author: Paul Douglas is a nationally-recognized Penn State meteorologist, founder and majority owner of Praedictix, based in the Twin Cities. Over the years his television meteorology career took him to Wilkes-Barre/Scranton, New York City, Chicago and the Twin Cities, where he has lived since 1983. He has started 7 weather-tech companies, created special effects for Steve Spielberg’s movies “Twister” and “Jurassic Park” and authored 4 books on weather and climate, most recently “A Kid’s Guide to Saving the Planet: It’s Not Hopeless and We’re Not Helpless”. Paul’s CV is here.