
October: A Month of Manic Meteorology
Welcome to a fickle month of full-bodied weather. October has brought everything from 90s to flooding rains, rare tornadoes and wild winds. Frozen water, too.
Average Twin Cities snowfall this month is .6 inches. We rarely see much more than flurries, but there are big exceptions.
The “Halloween Superstorm” dumped 8 inches of snow at MSP on October 31, 1991. On October 1, 1999 4 inches of slushy fun blanketed Montgomery, Northfield and Springfield.
I saw numerous reports of flurries over northern Minnesota yesterday, but the maps show a return to milder weather next week.
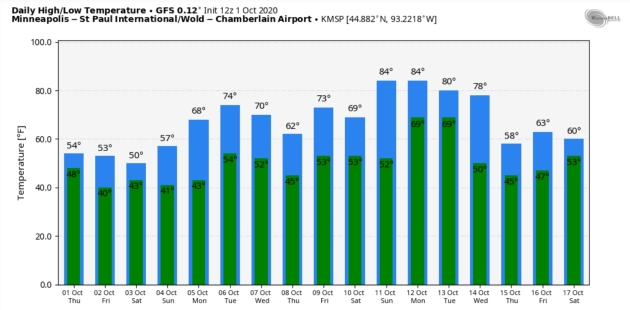
NOAA’s GFS model insists the metro area will hit 80F by the second weekend of October. I’m dubious, but it’s 2020. Anything could happen, right?
A frost is possible in the suburbs, likely over greater Minnesota this morning. A pop-up shower is possible Saturday, but Sunday looks sunnier and better. A streak of 70s are about a week away.
Hopefully we’ll get some rain. September was 1-3 inches drier than average, statewide.
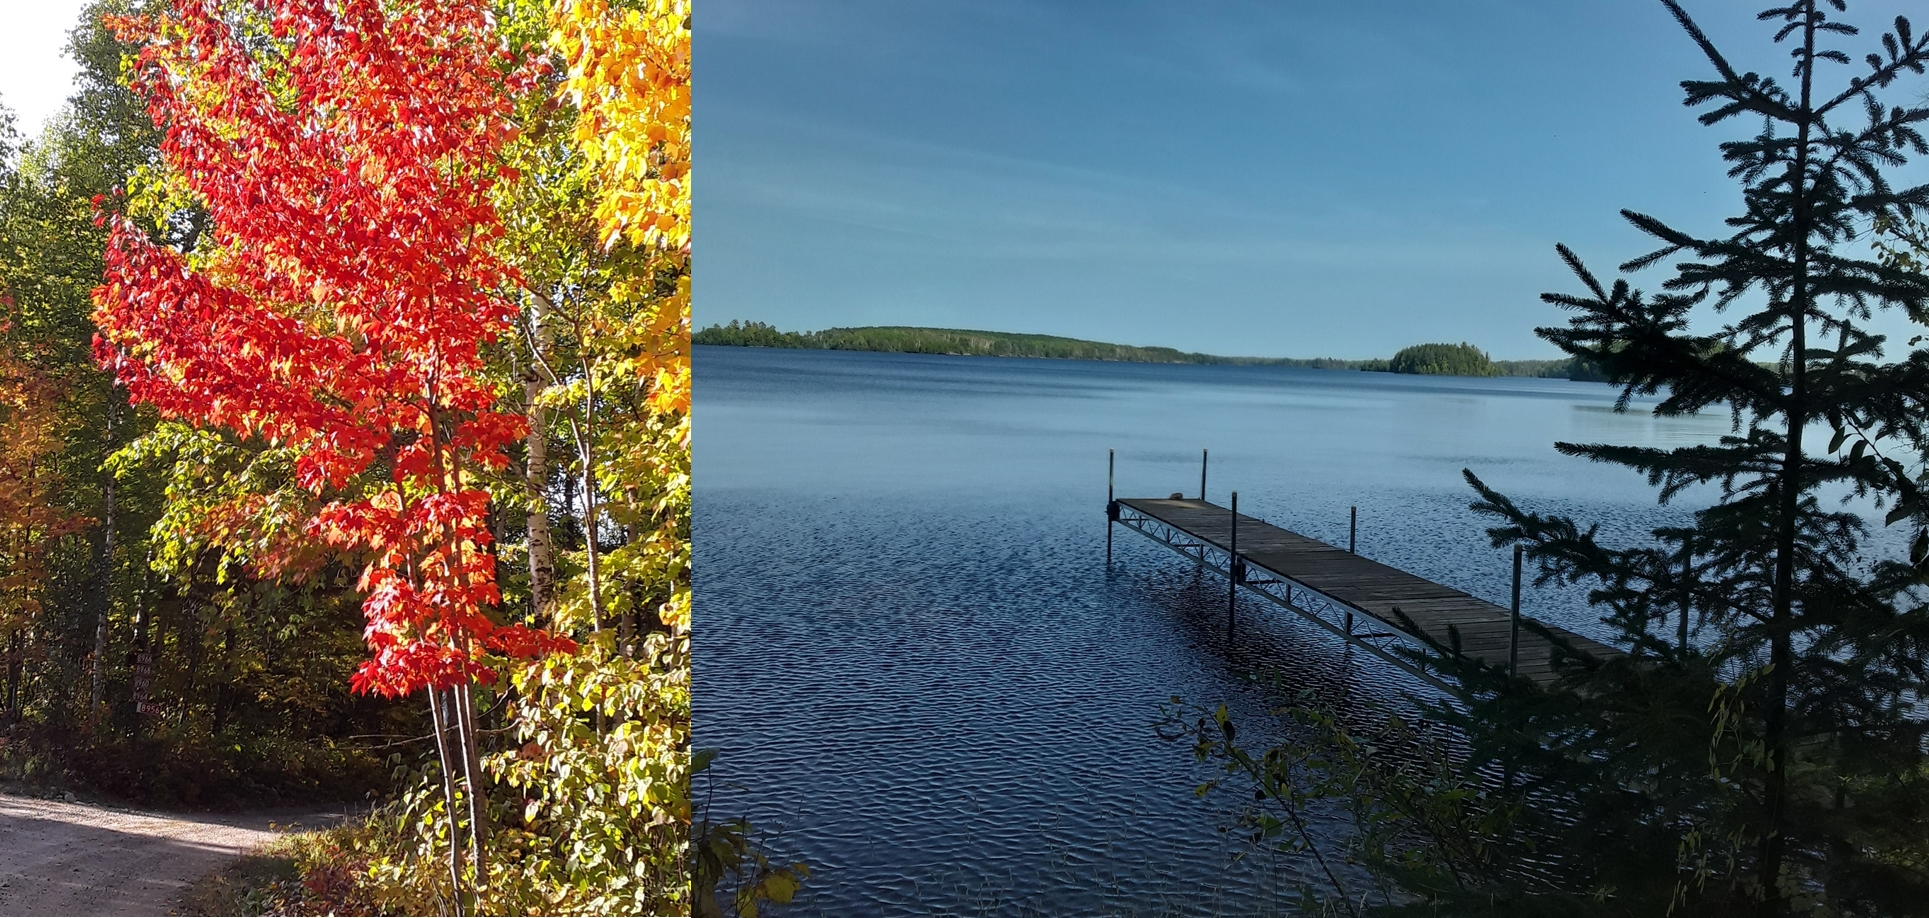
Bear Island Lake images: David Lankinen.
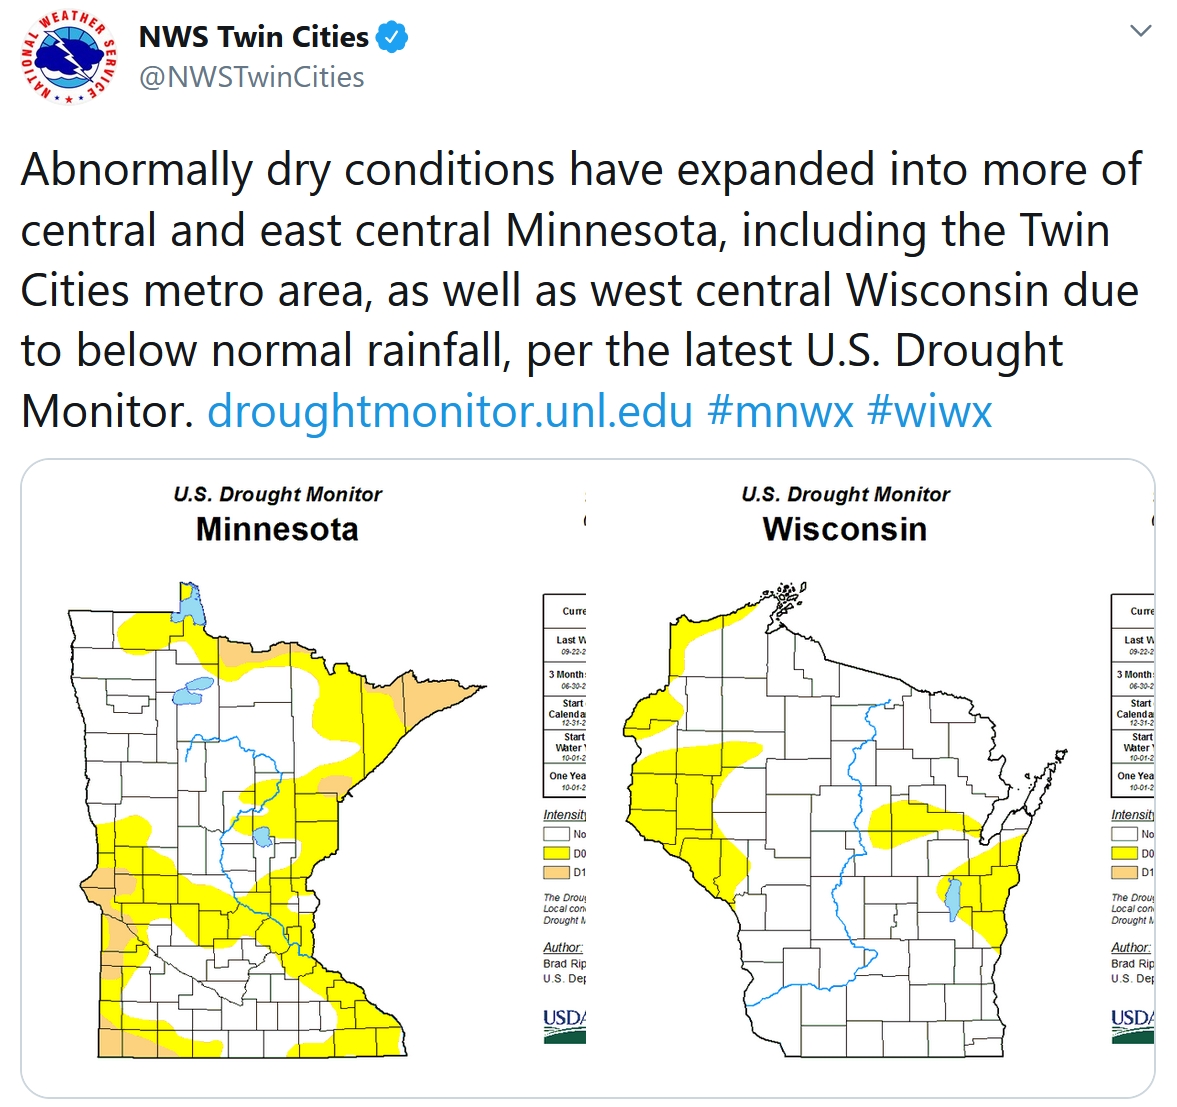
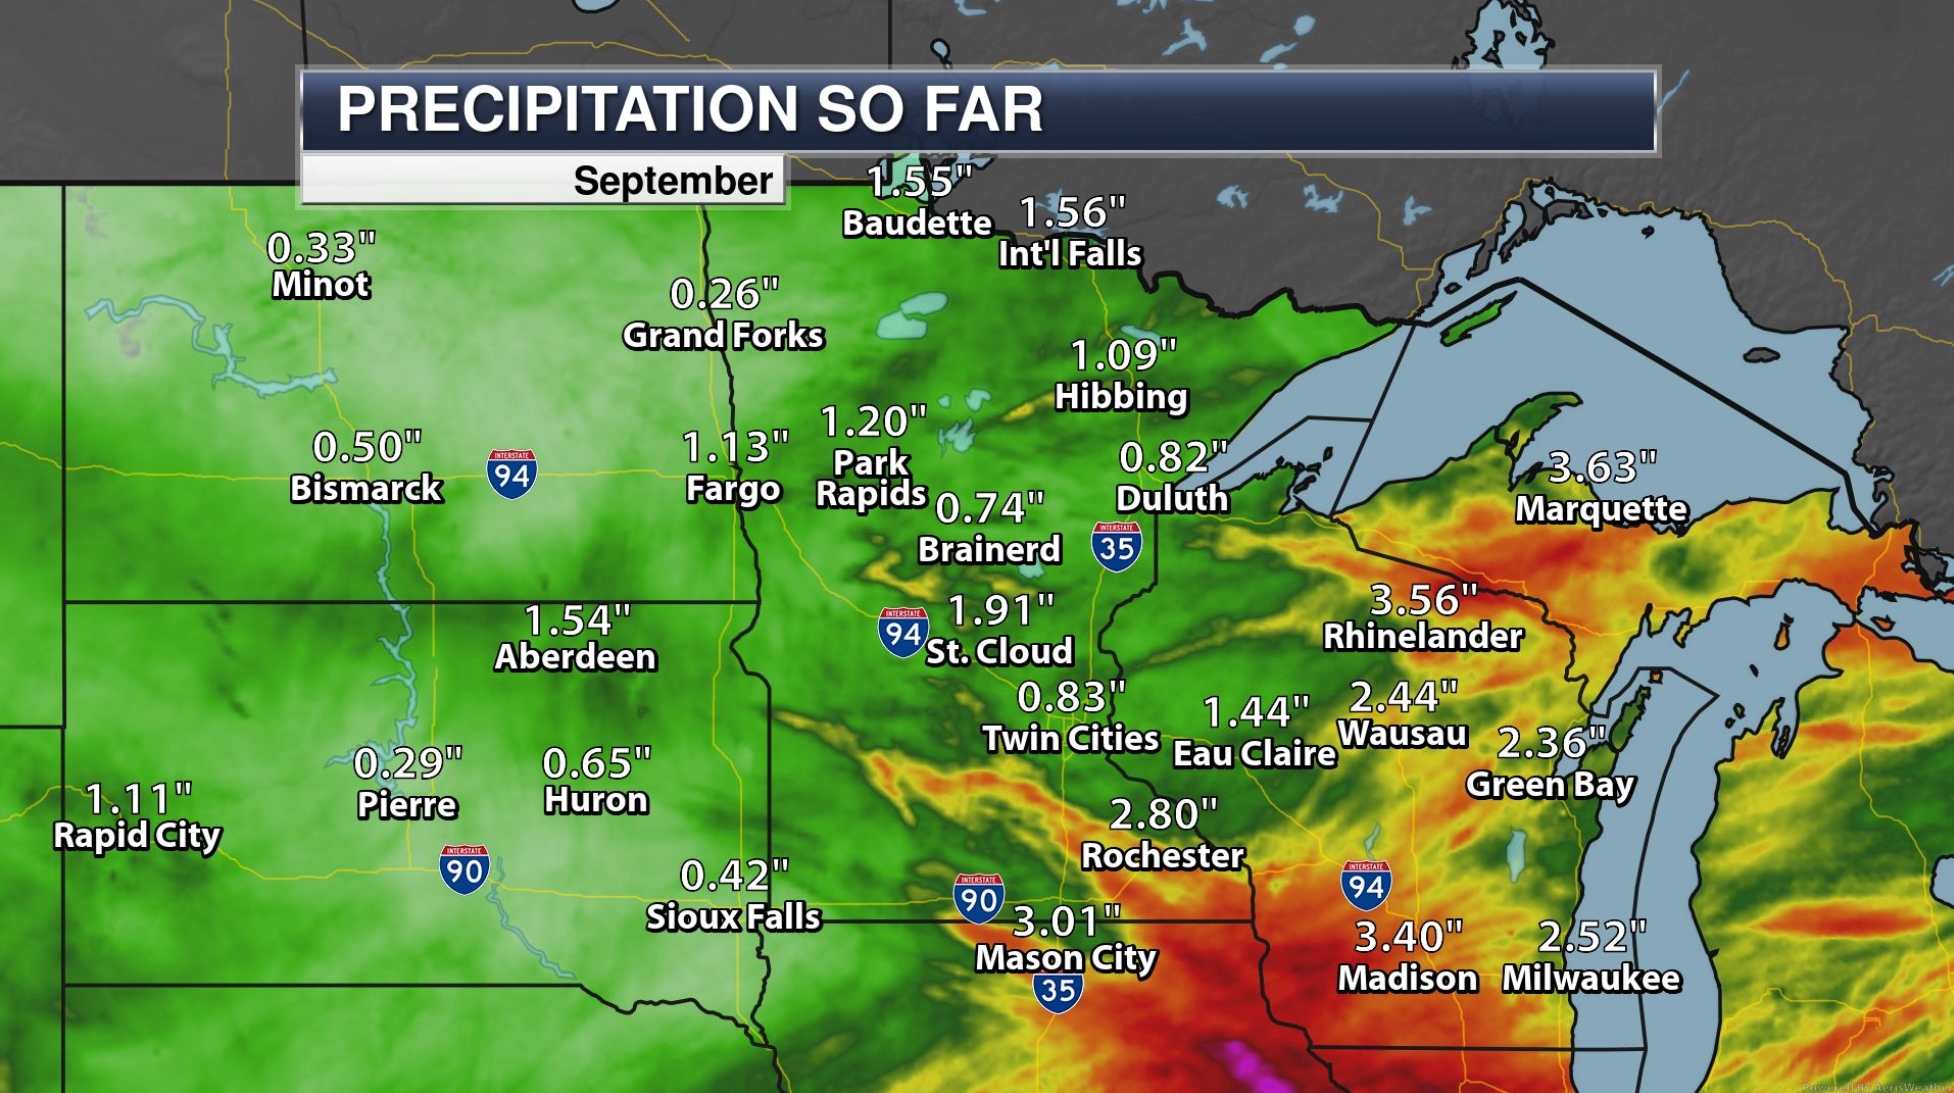
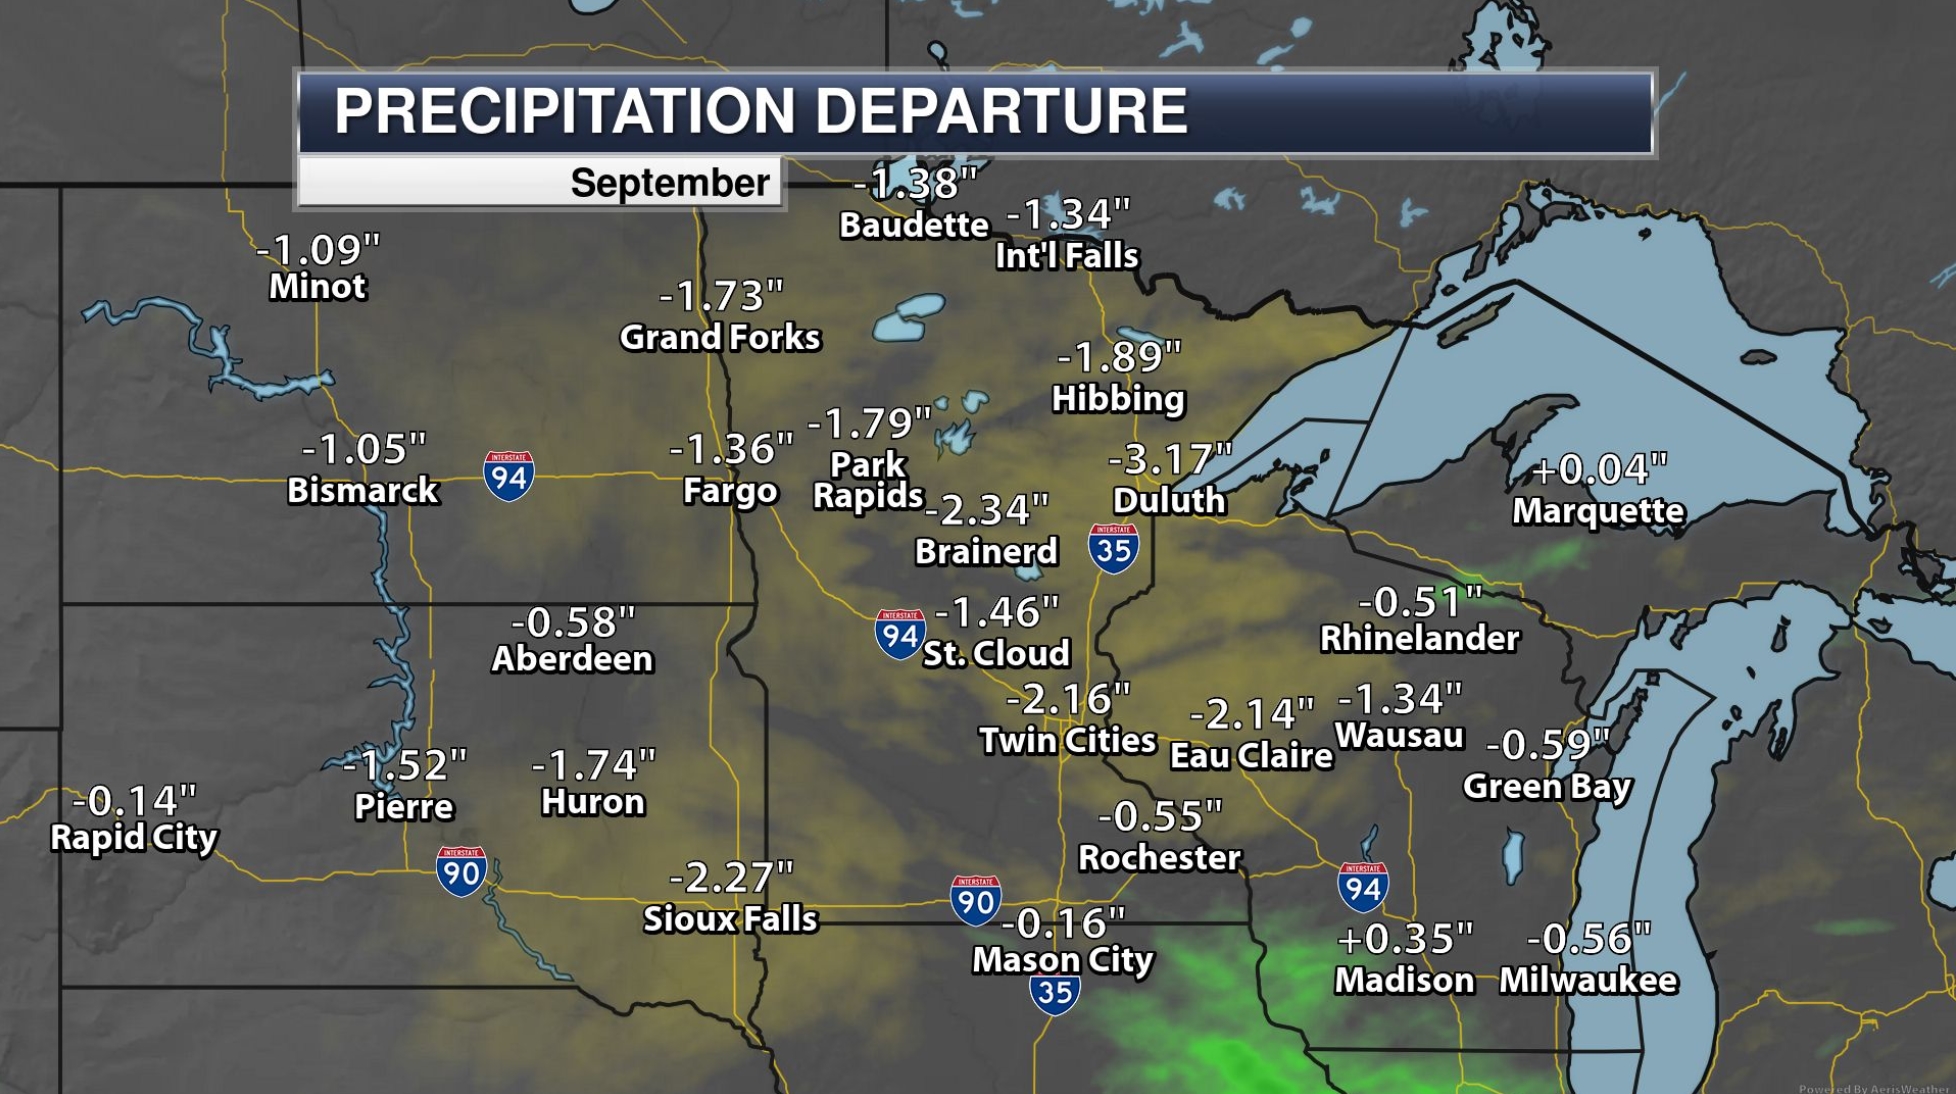
Drier Than Average September. Rainfall last month was 1-2″ less than normal across most of Minnesota and western Wisconsin. Only far southeastern counties saw above normal precipitation.
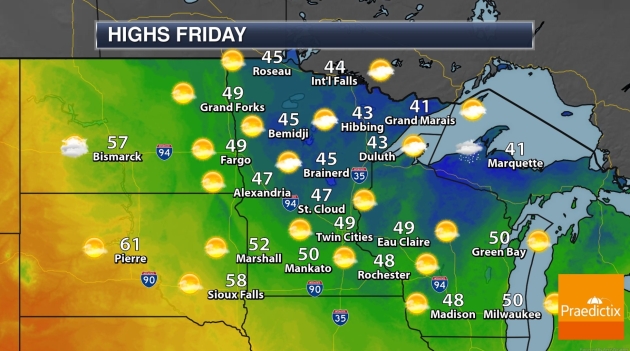
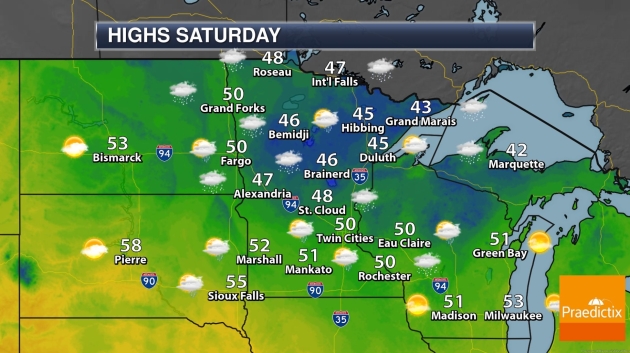
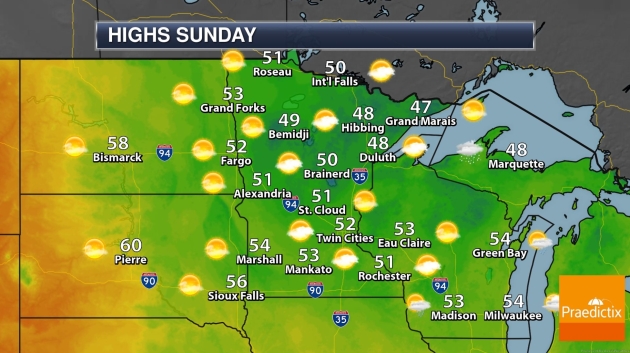
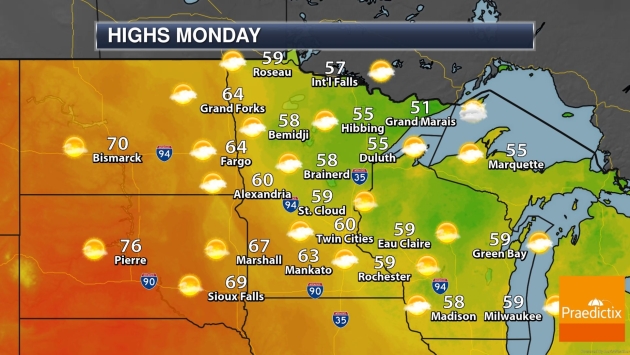
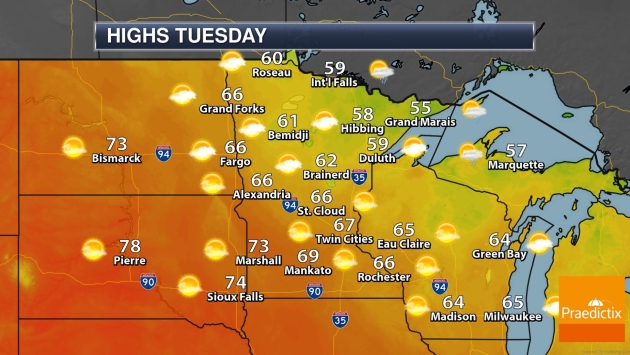
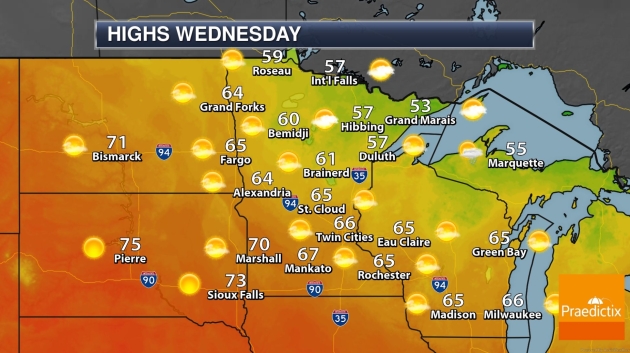
Welcome Warming Trend. Both NOAA and ECMWF show a streak of 60s next week, maybe 70s by the second weekend of October. Yes please. Map sequence above: Praedictix and AerisWeather.
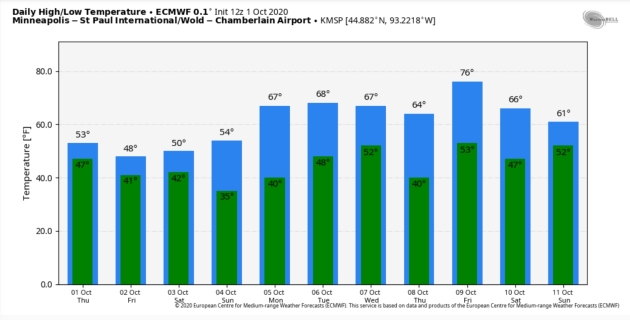
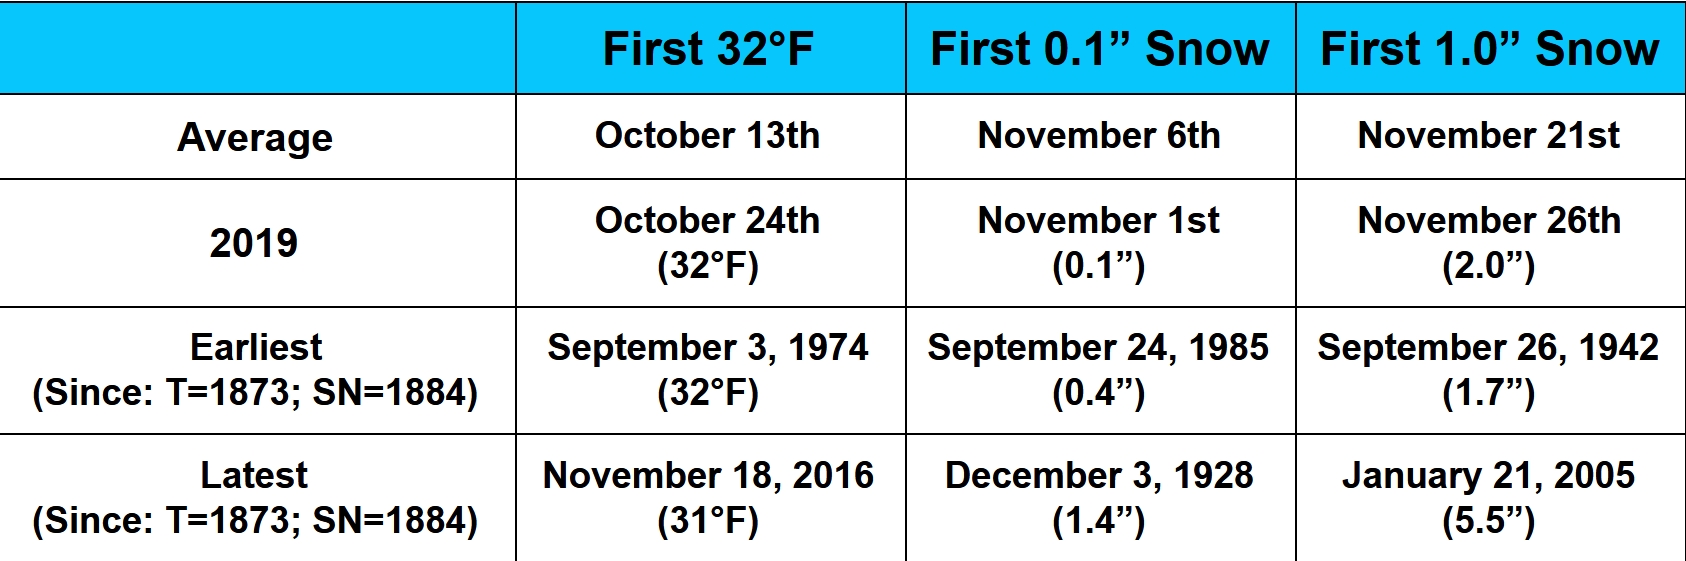
Twin Cities Data. Impress and amaze your friends with the statistics above! Good times.
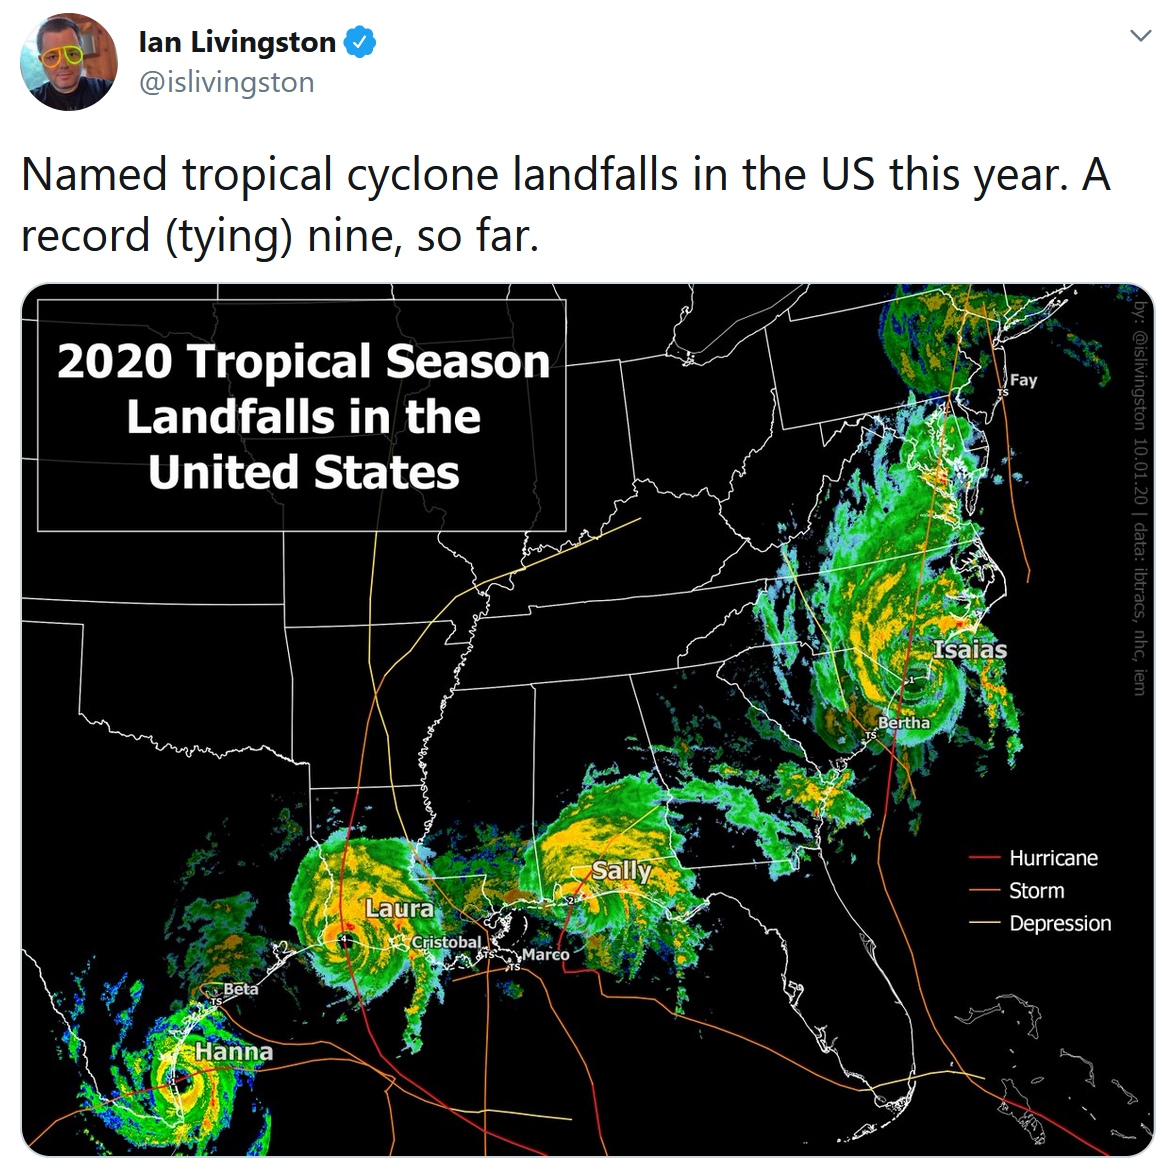
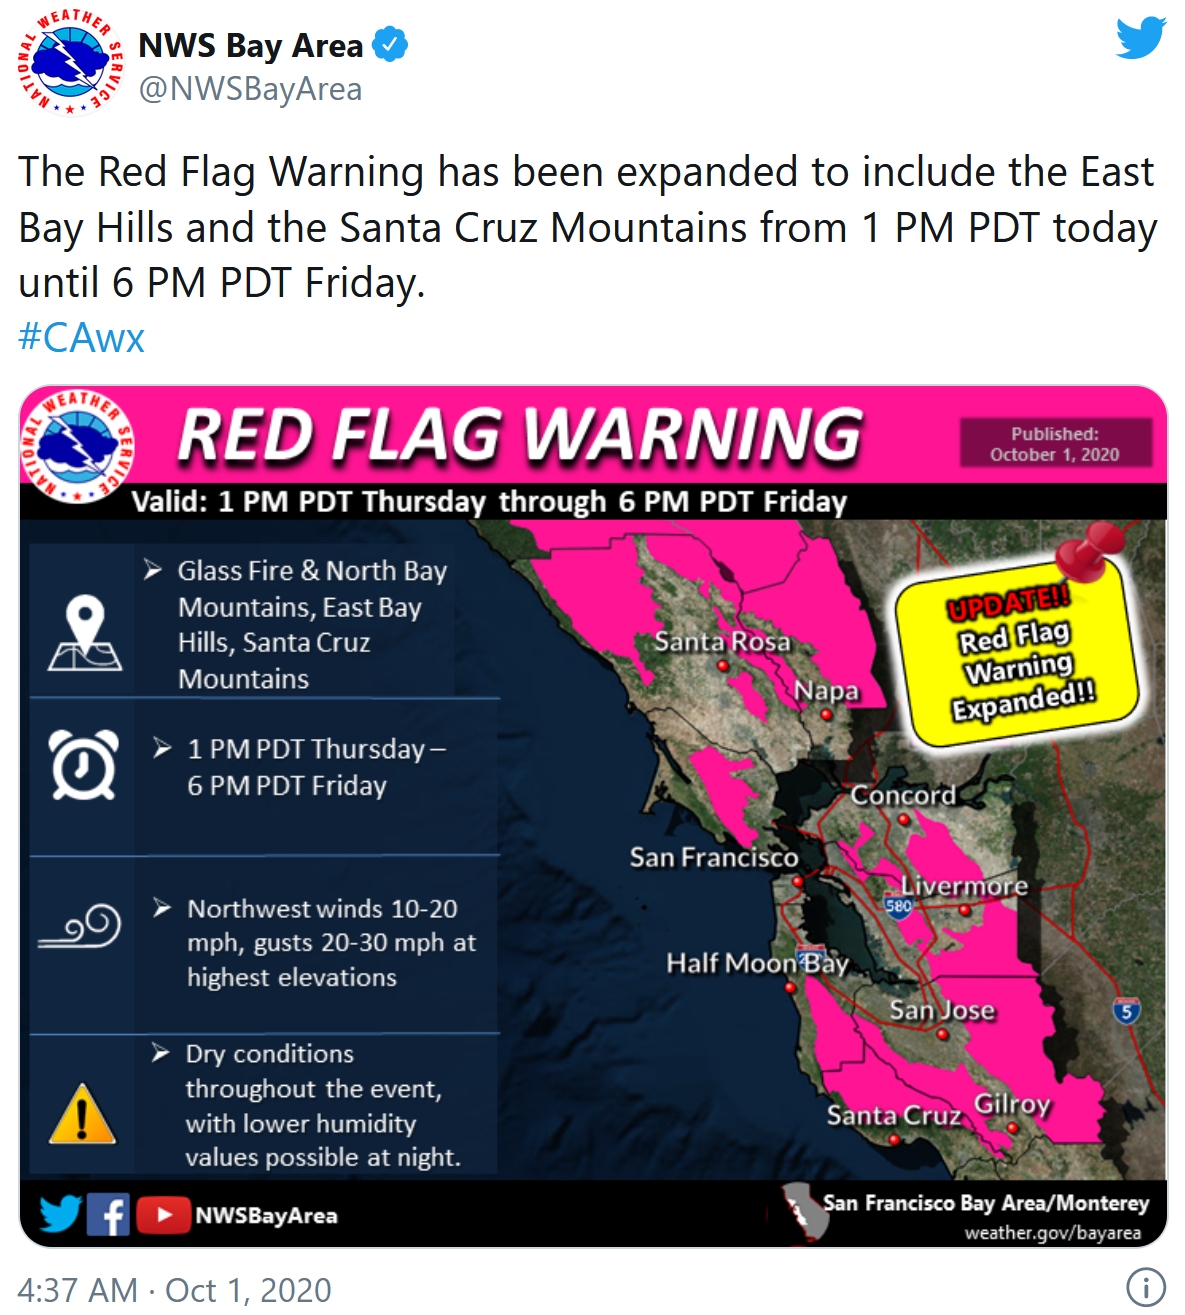
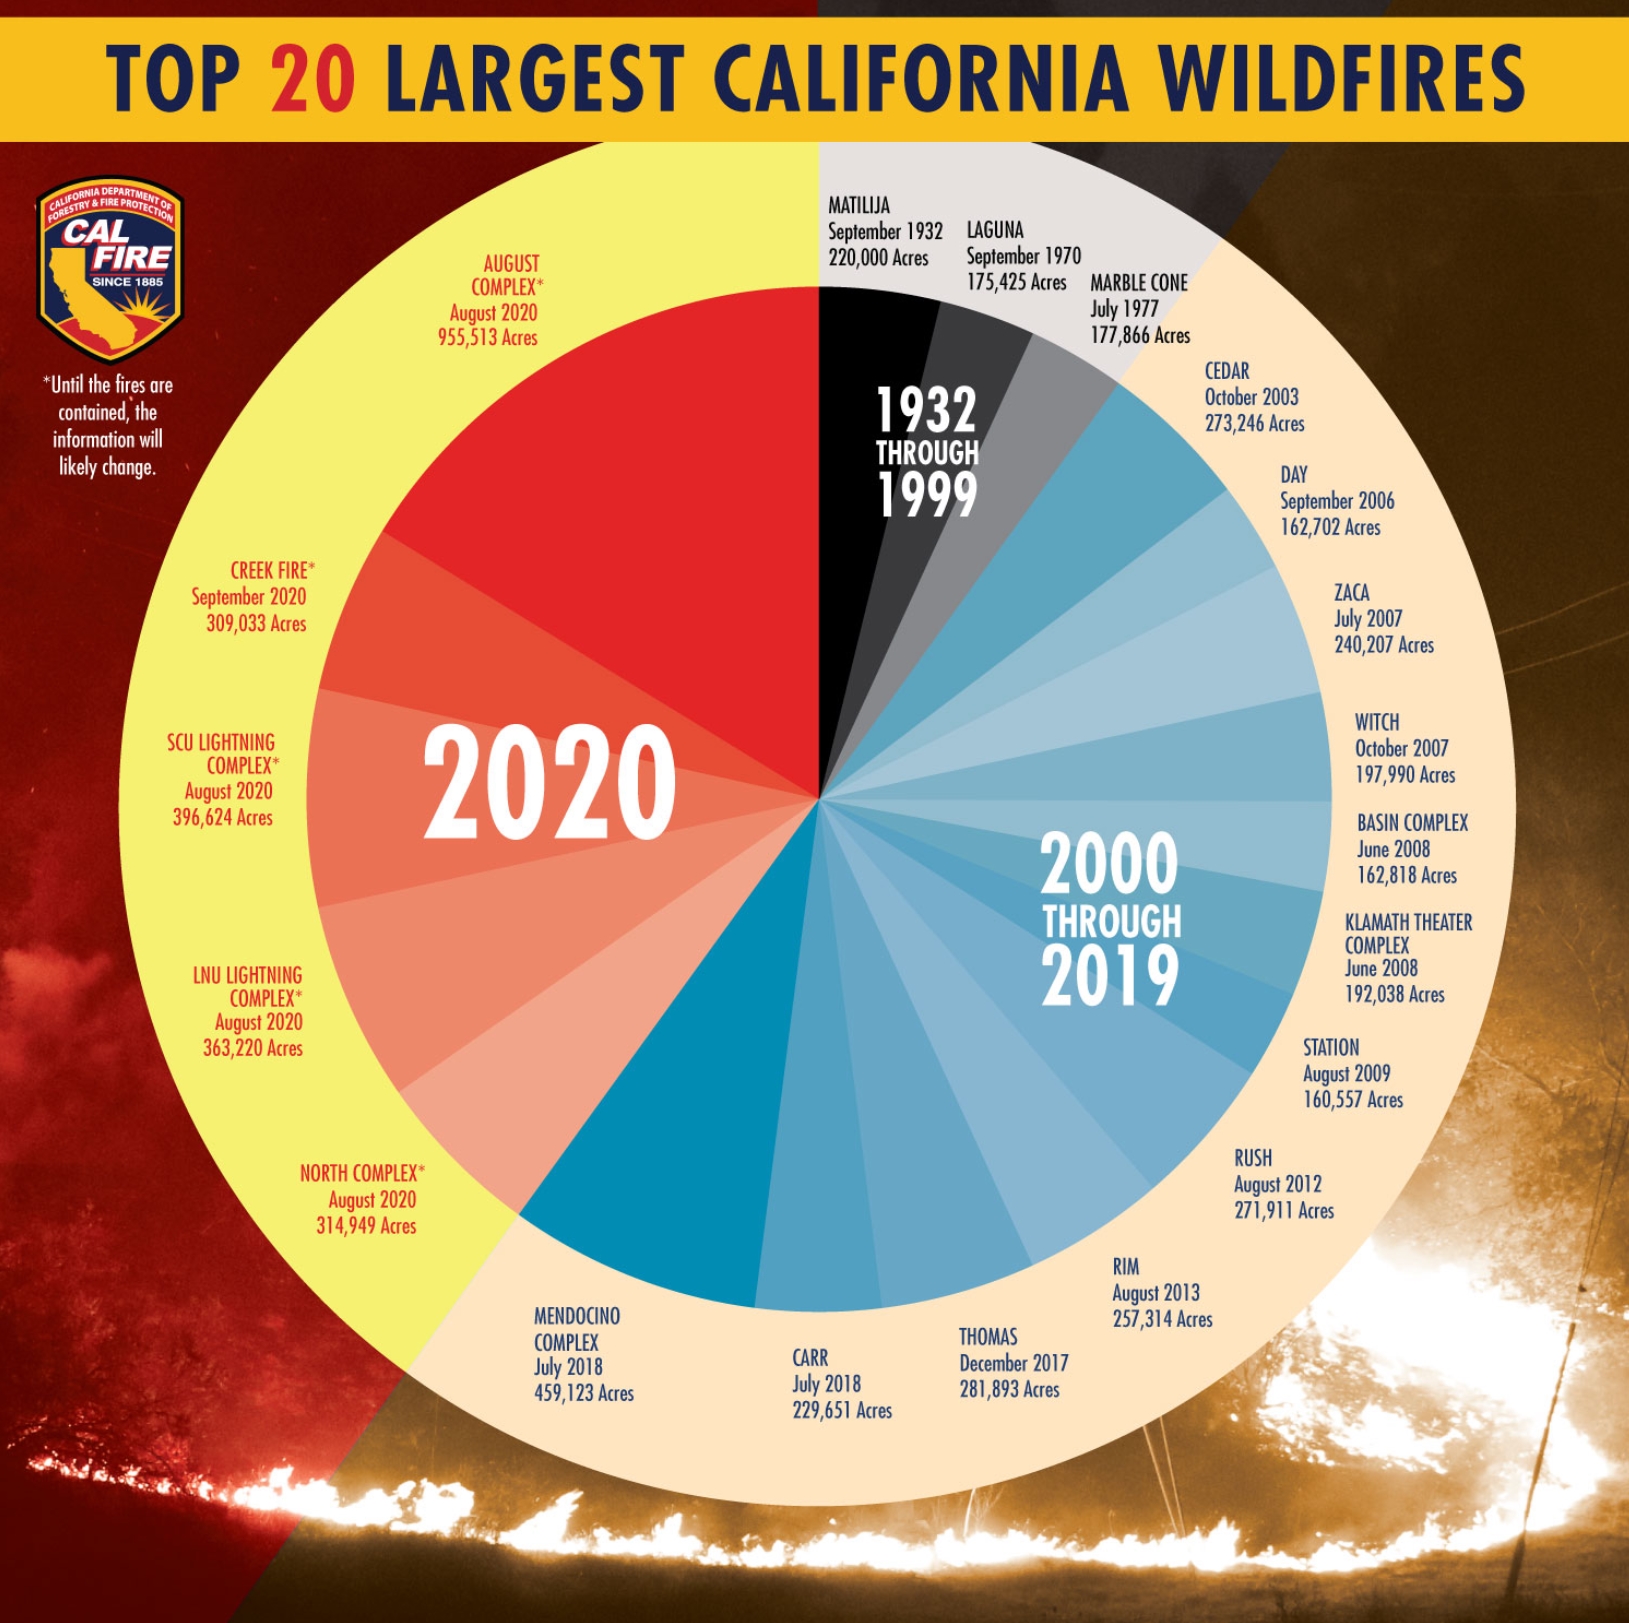
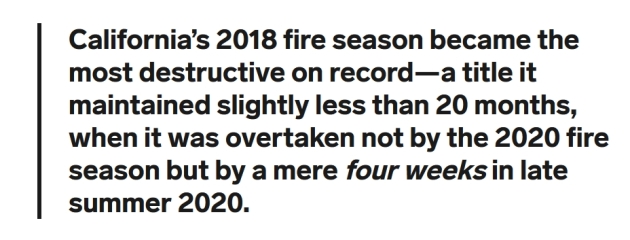
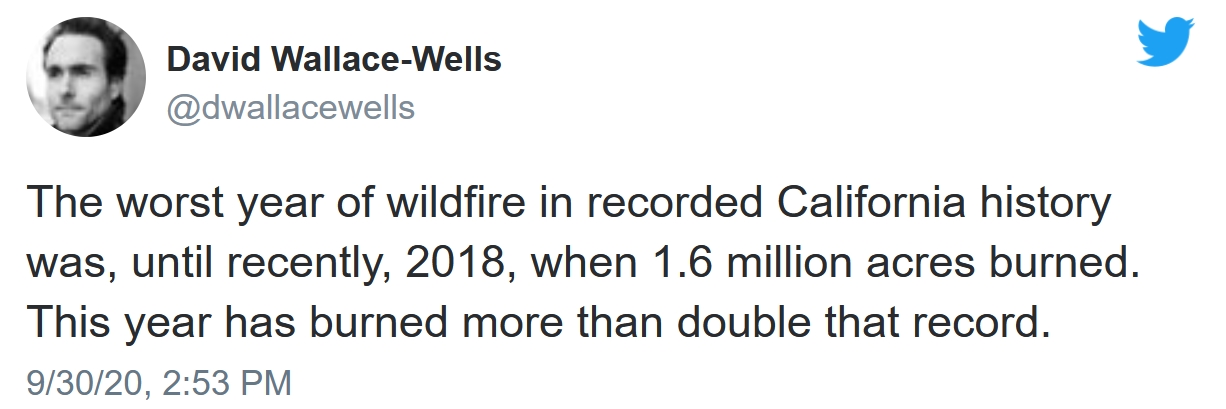
California, Wildfires Prompt New Warnings Amid Record Heat, Erratic Winds. Capital Weather Gang has details and perspective: “…California is in the midst of its worst wildfire season on record, with more than 3.9 million acres burned, and five of the Top 20 largest wildfires in state history taking place this year. Scientists say California’s 2020 fire season, and the severe blazes that have extended north to Oregon and Washington, have clear links to human-caused climate change. There has been an increase in acres burned in large fires across the West due to global warming, and projections call for the region to become even hotter and drier, making the region more susceptible to fire sieges like the one taking place. A study published in August shows California’s frequency of fall days with extreme fire-weather conditions has more than doubled since the 1980s…”
The West’s Infernos Are Melting Our Sense of How Fire Works. WIRED.com (paywall) provides needed perspective on what’s happening: “…In making sense of Western wildfires, total acres burned are far less important than the increasingly capricious violence of our most extreme blazes. It is as if we’ve crossed some threshold of climate and fire fuel into an era of uncontrollable conflagrations. “Not only is the size and severity increasing, but the nature of fire is changing,” says David Saah, director of Pyregence, a group of fire-science labs and researchers collaborating on the problem. Still more concerning, given the trend toward fires dramatically more catastrophic than anything we’ve yet seen: The physics of large-scale wildfires remain so poorly understood that fire-modeling software is often effectively powerless to predict where they will next occur, much less how they will unfold once they do. If there is any good news, it is that, as Saah puts it, “the science for a lot of this stuff is under way...”

NOAA Turns 50! We can debate which weather models are more accurate, but there’s little doubt (in my mind, at least) that America has the best weather service on the planet. Kudos to the men and women of NOAA who keep us informed, in good weather and bad. Details via NOAA: “Since its inception in 1970, NOAA has evolved into one of the world’s premier science organizations with a mission that spans from the surface of the sun to the floor of the ocean. Our work is incredibly diverse, and it’s difficult to capture everything we do in one place. We hope this graphic speaks volumes about how the meaningful work we do is embedded into the fabric of American lives and livelihoods...”
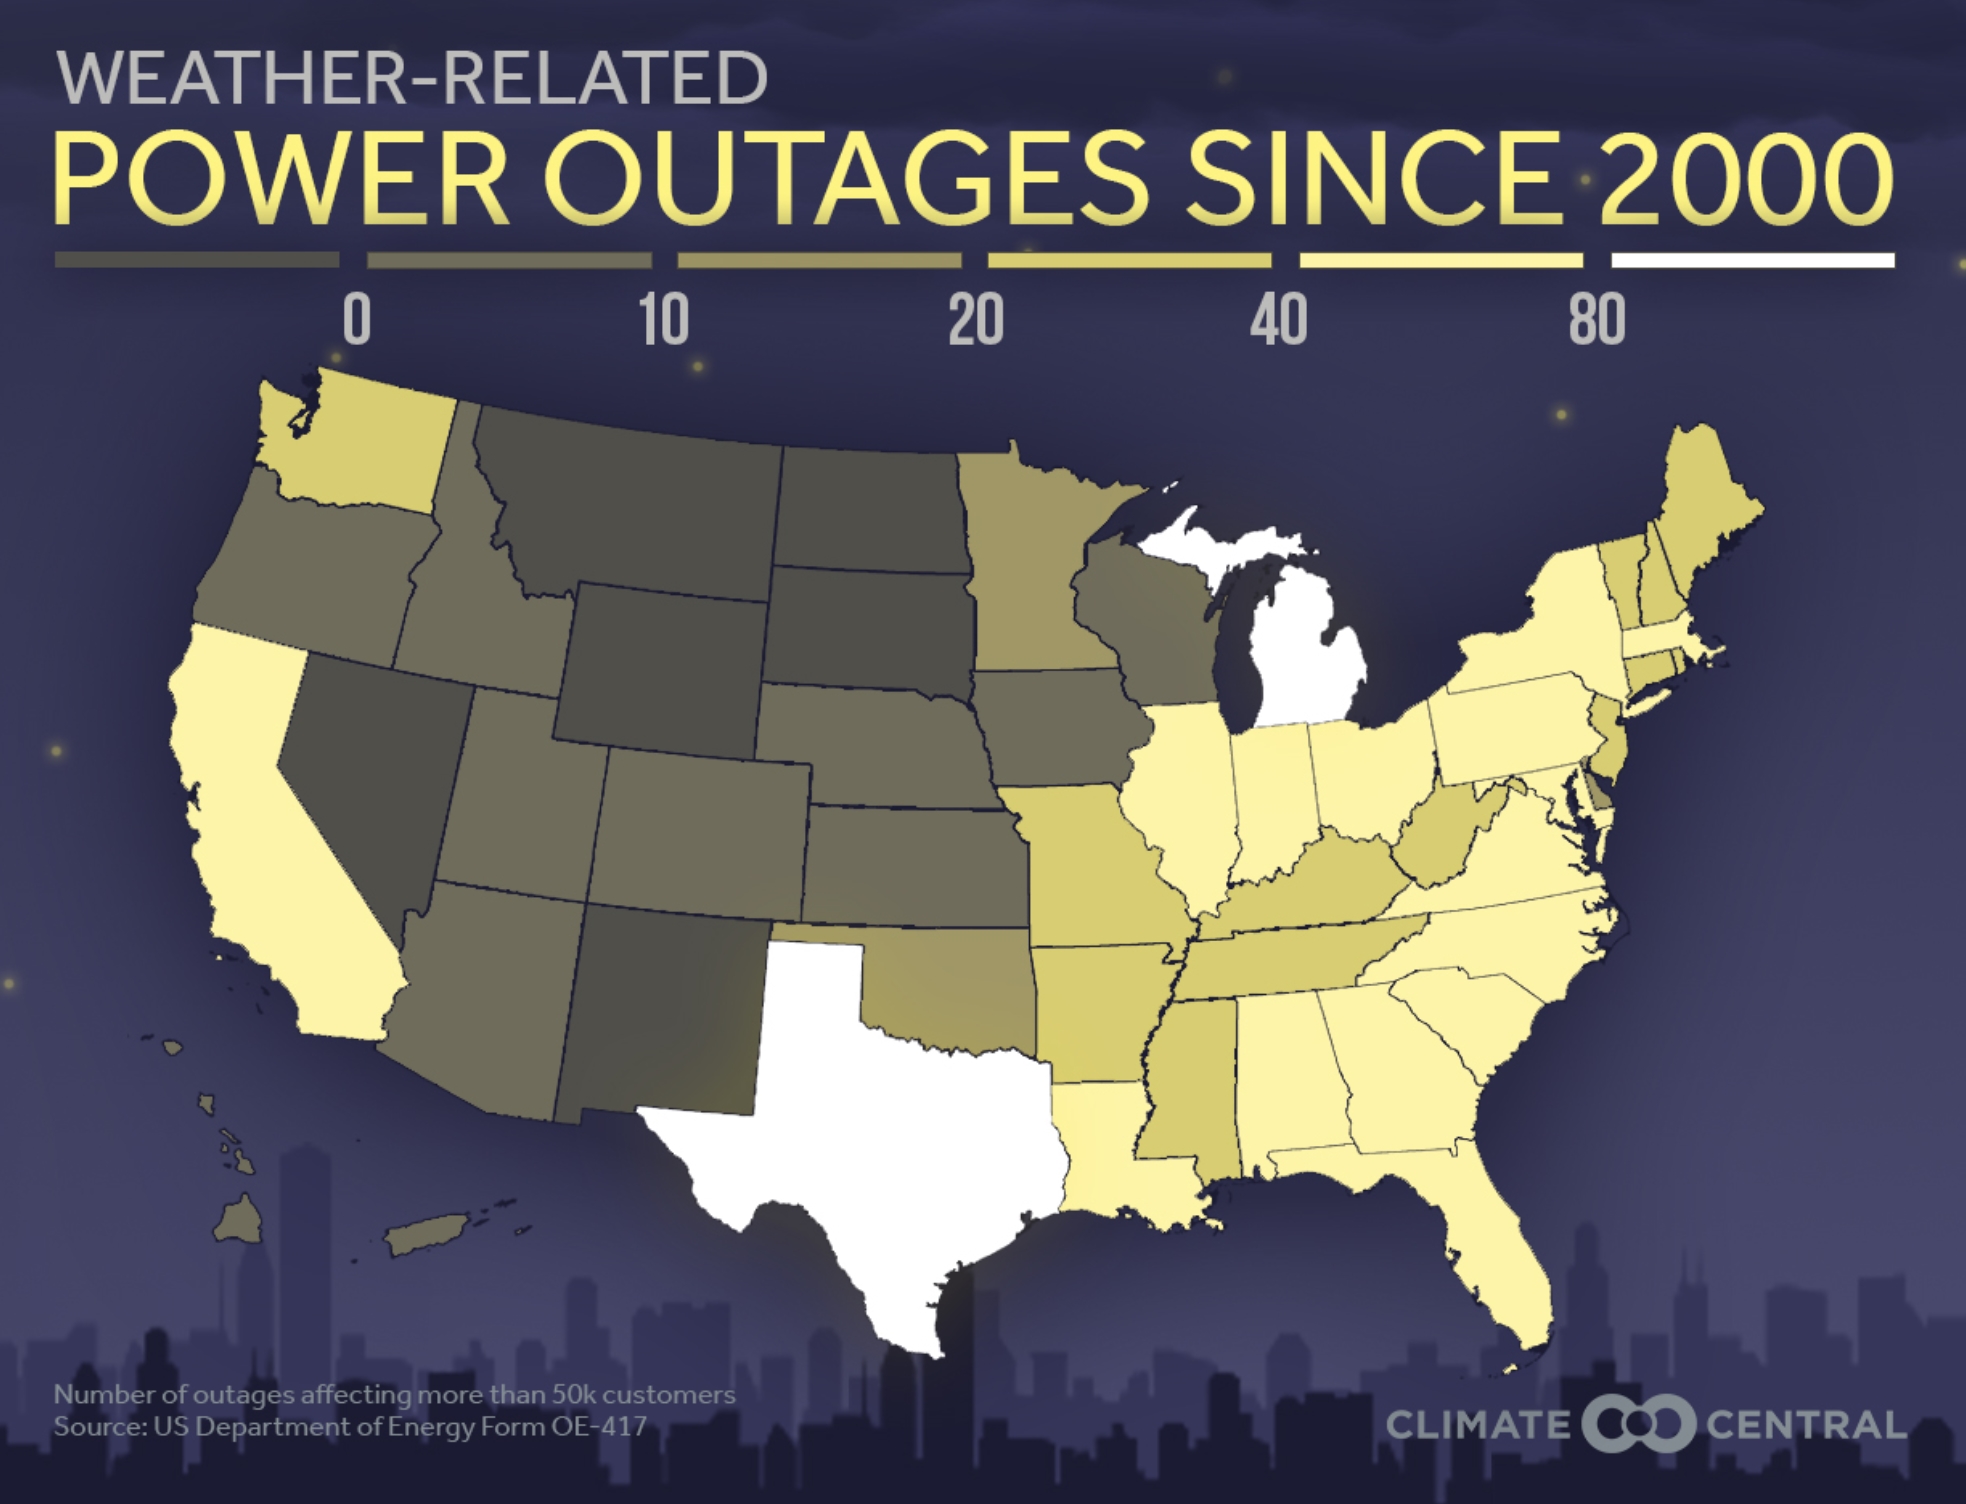
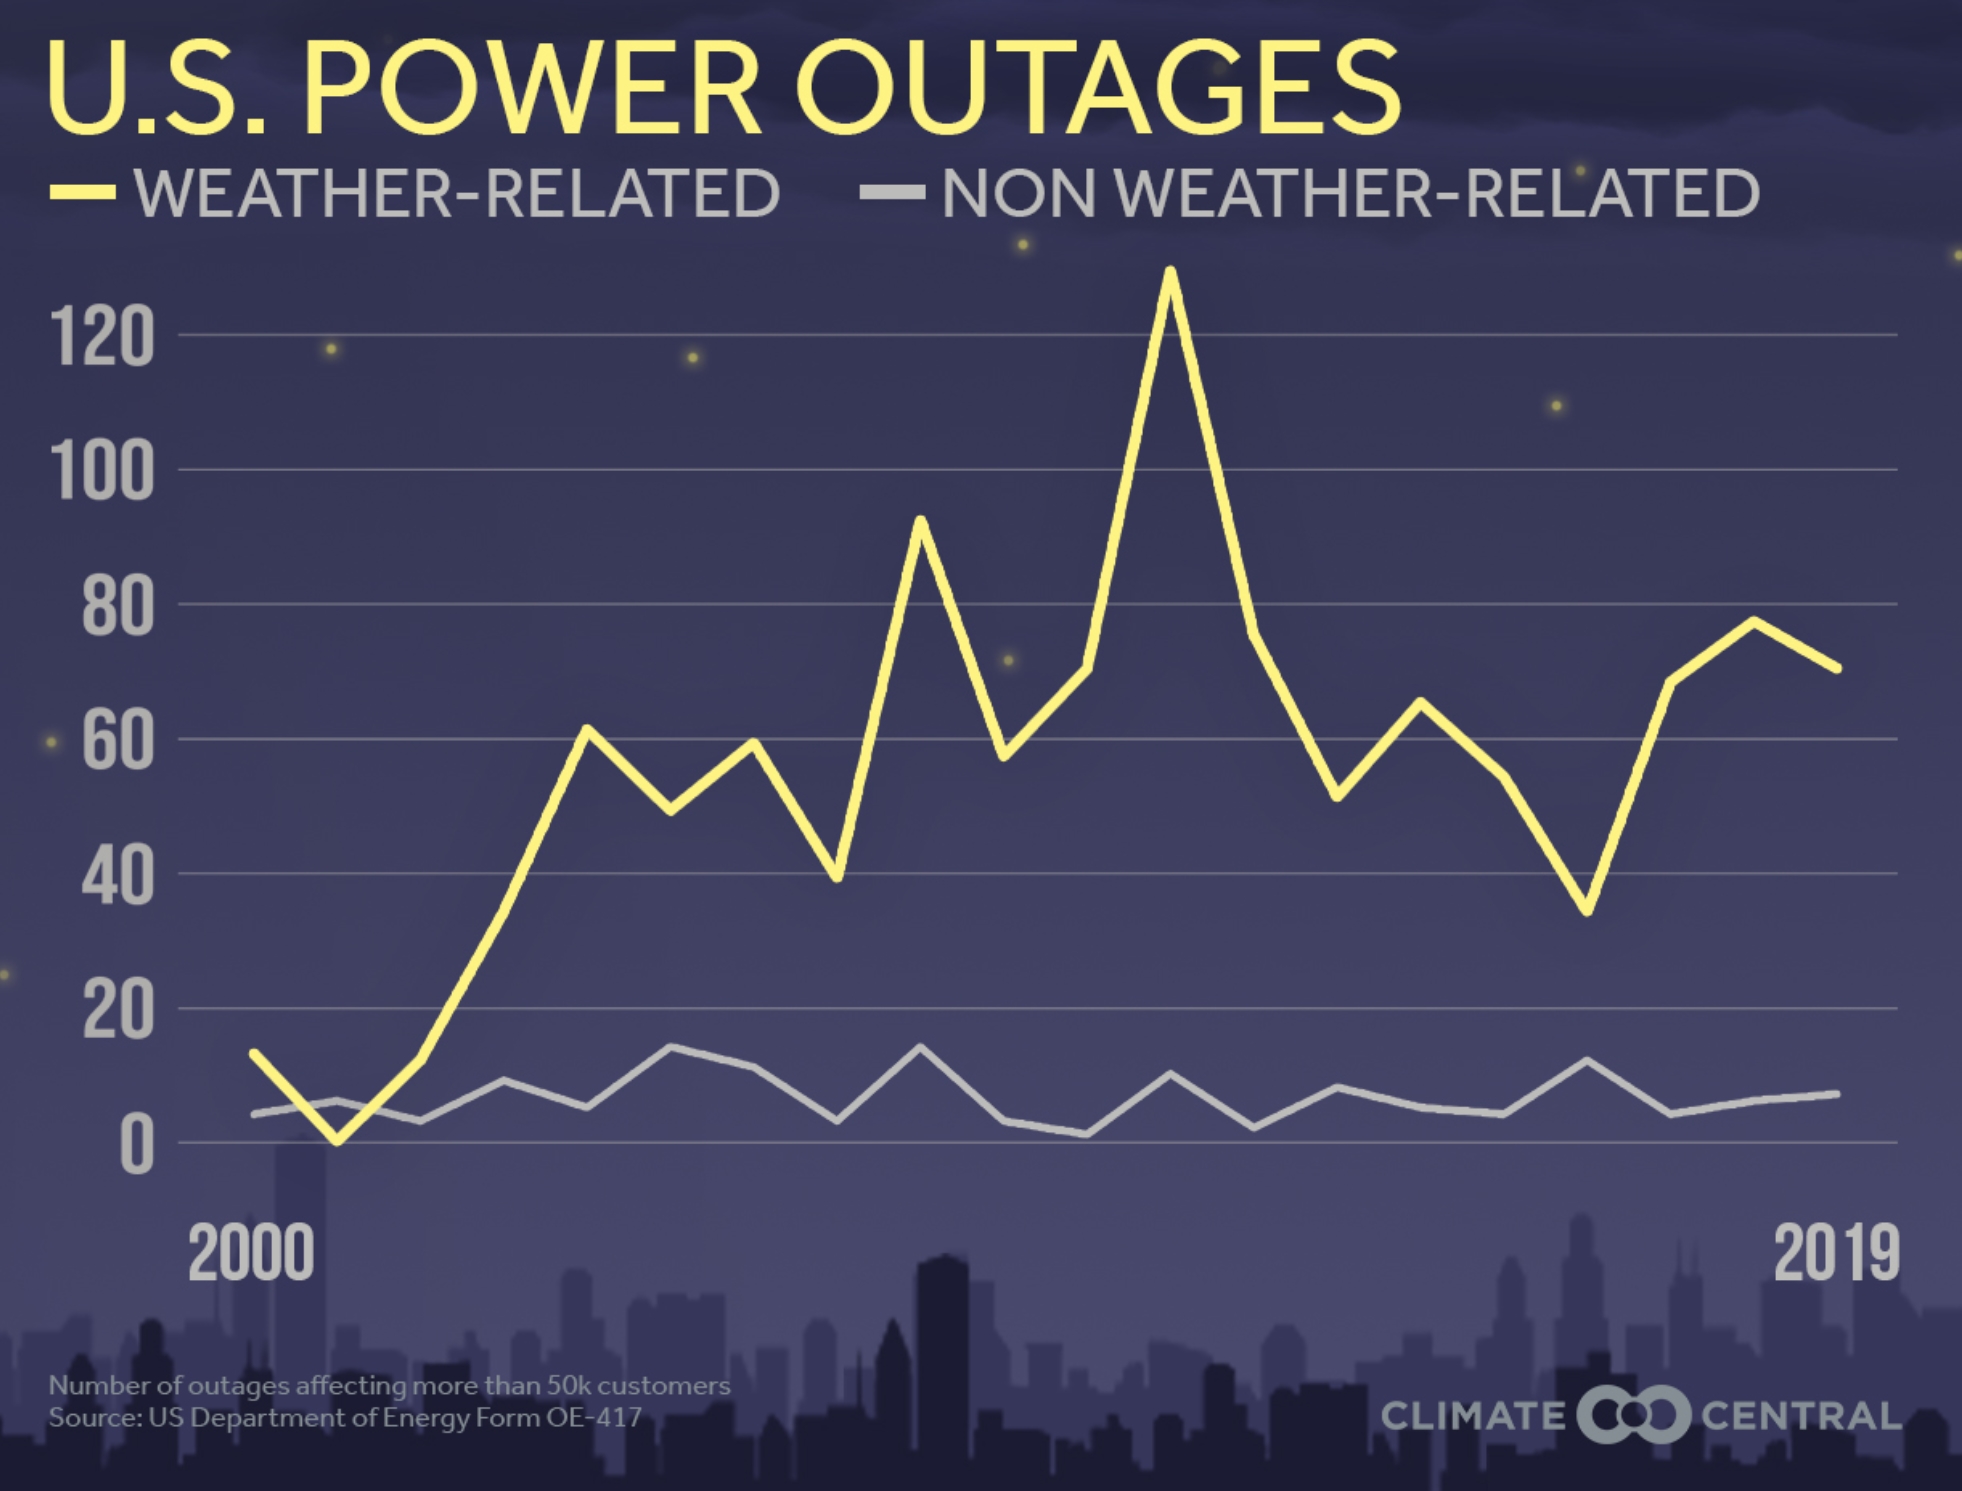
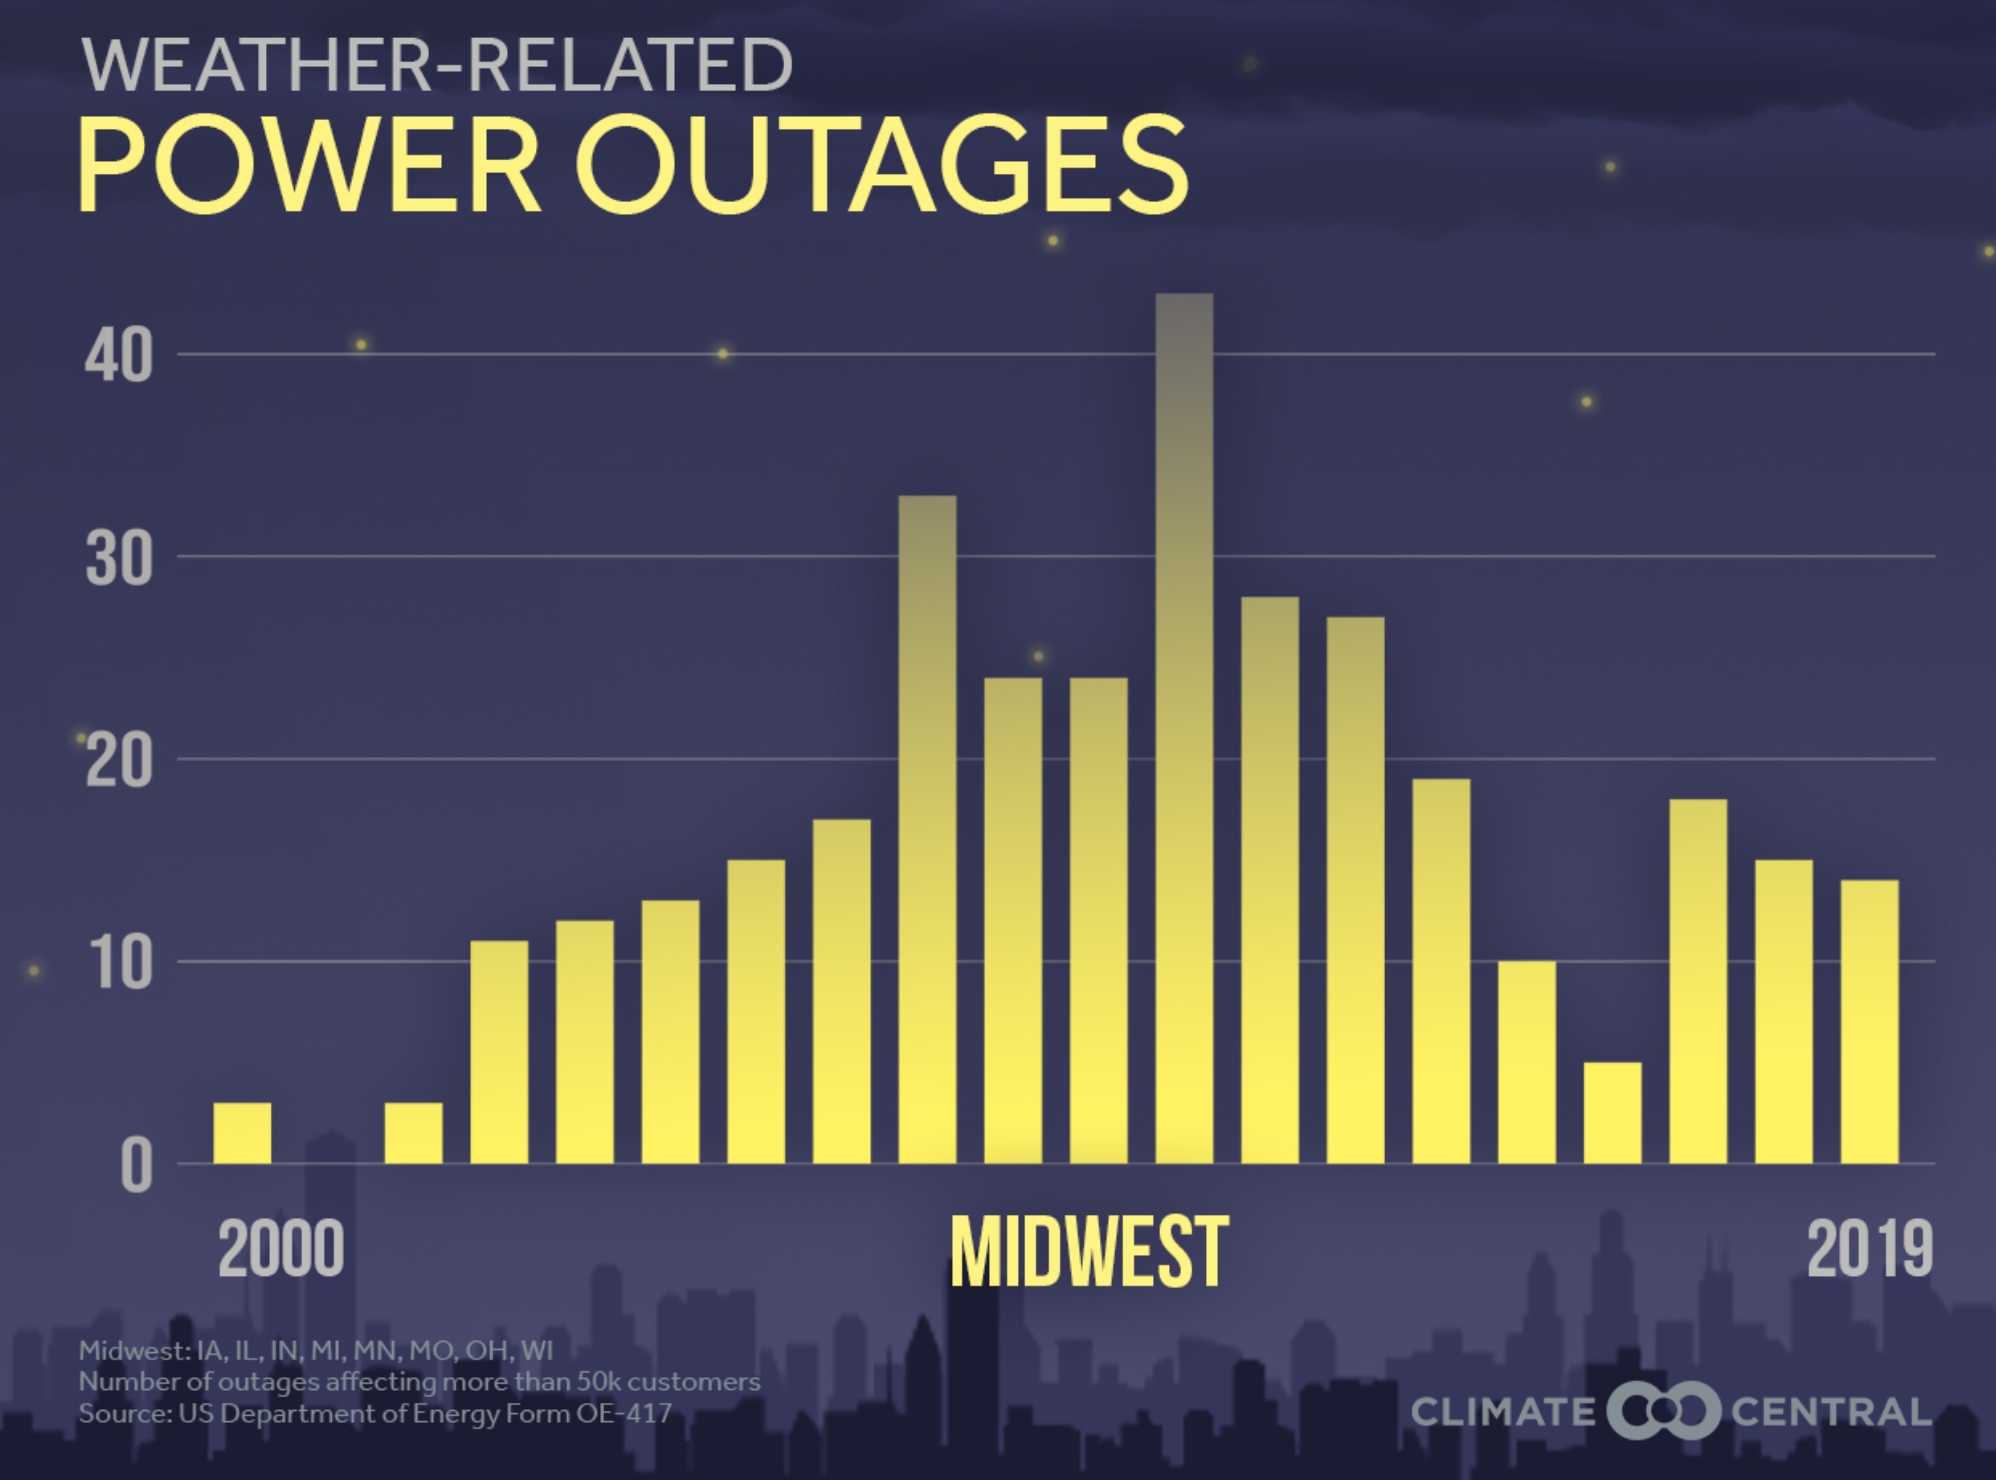
Extreme Weather and Power Outages. How much is natural variability, demographics (more people living in risky areas) and a rapidly changing climate? Climate Central has perspective: “…Hurricanes, wildfires, ice storms, flooding, heat waves and other extreme weather events are growing in number or intensity with climate change. Combined with the nation’s aging electrical infrastructure, extreme weather is causing frequent damage to our electrical system, costing Americans and the economy tens of billions of dollars each year, and impacting public health. Between 2003 and 2012, weather-related outages are estimated to have cost the U.S. economy an inflation-adjusted annual average of $18 billion to $33 billion. While for many, power outages are a nuisance and economically disruptive, they have the potential to become life-threatening in a matter of hours for certain vulnerable populations. Loss of electricity puts health care facilities at risk and can knock out essential equipment. Refrigeration, heating and cooling come to mind first. But it also halts potable water pumping equipment, and stalls sewage treatment plants, which can force the release of raw sewage into waterways...”
FRIDAY: Frost early? Mostly cloudy, but less wind. Winds: NW 5-10. High: 48
SATURDAY: Squirts of sun, passing shower risk. Winds: NW 5-10. Wake-up: 38. High: near 50
SUNDAY: Partly sunny, better leaf-peeping. Winds: NW 5-10. Wake-up: 36. High: 54
MONDAY: Mild sunshine, late shower north. Winds: S 15-30. Wake-up: 40. High: 65
TUESDAY: Partly sunny, late shower risk. Winds: W 10-20. Wake-up: 50. High: 67
WEDNESDAY: Some sun, gusty – slightly cooler. Winds: NW 15-25. Wake-up: 49. High: near 60
THURSDAY: Sunny, breezy and pleasant. Winds: S 10-20. Wake-up: 43. High: 66