
El Niño is strengthening rapidly across the equatorial Pacific, and the 2026 event is already among the strongest observed in the historical record.
NOAA’s Climate Prediction Center (CPC) has an El Niño Advisory in place. The latest observations show exceptionally warm sea-surface temperatures across the central and eastern equatorial Pacific. NOAA says there is greater than a 90% chance that El Niño reaches very strong strength during the Northern Hemisphere fall and winter of 2026-27.
What makes this event particularly notable is not only its strength, but also its timing. The Pacific has warmed dramatically during the summer, well ahead of the typical peak of El Niño conditions.
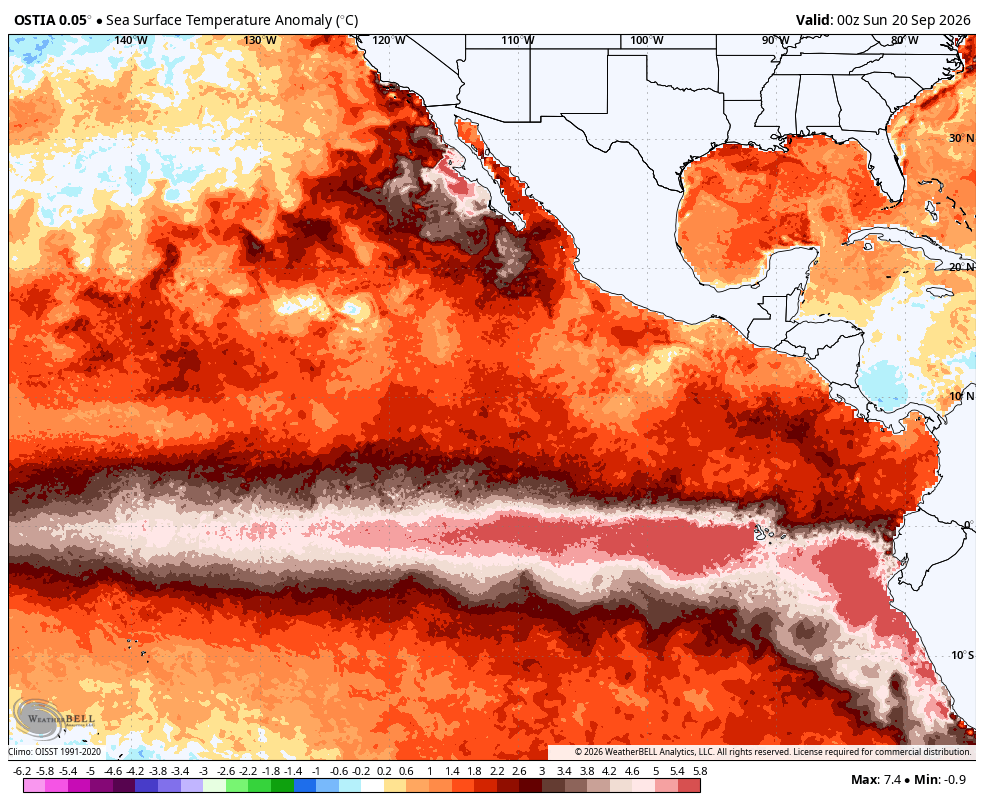
Sea Surface Temperature Anomaly in the Eastern Pacific
Exceptional warmth in the Nino-3.4 regionThe Niño-3.4 region, located across the central equatorial Pacific, is one of the primary areas used to monitor El Niño. NOAA’s September 17 seasonal outlook reported a weekly Niño-3.4 anomaly of approximately +2.0°C, while the weekly index centered on September 16 had climbed to around +3.0°C. The September 10 ENSO Diagnostic Discussion also reported that sea-surface temperature anomalies had exceeded +3°C in portions of the eastern equatorial Pacific. (NOAA)
The magnitude of the warming is extraordinary for this early in the season. The strongest historical El Niño events of the modern record include 1982-83, 1997-98 and 2015-16. NOAA is currently using these three events as important analogs for the 2026-27 forecast. NOAA’s current forecast indicates a 75% probability that the October-December 2026 season reaches a historic El Niño strength, defined as a three-month RONI value of at least +2.5°C, which would exceed the strength of previous events dating back to 1950.
The temperature anomaly in the El Nino 3.4 Region reached +3.05C above average on September 21st, surpassing the previous record of +3.02C set on November 18th, 2015, which is the highlighted gray line in the upper right hand part of the graph below.
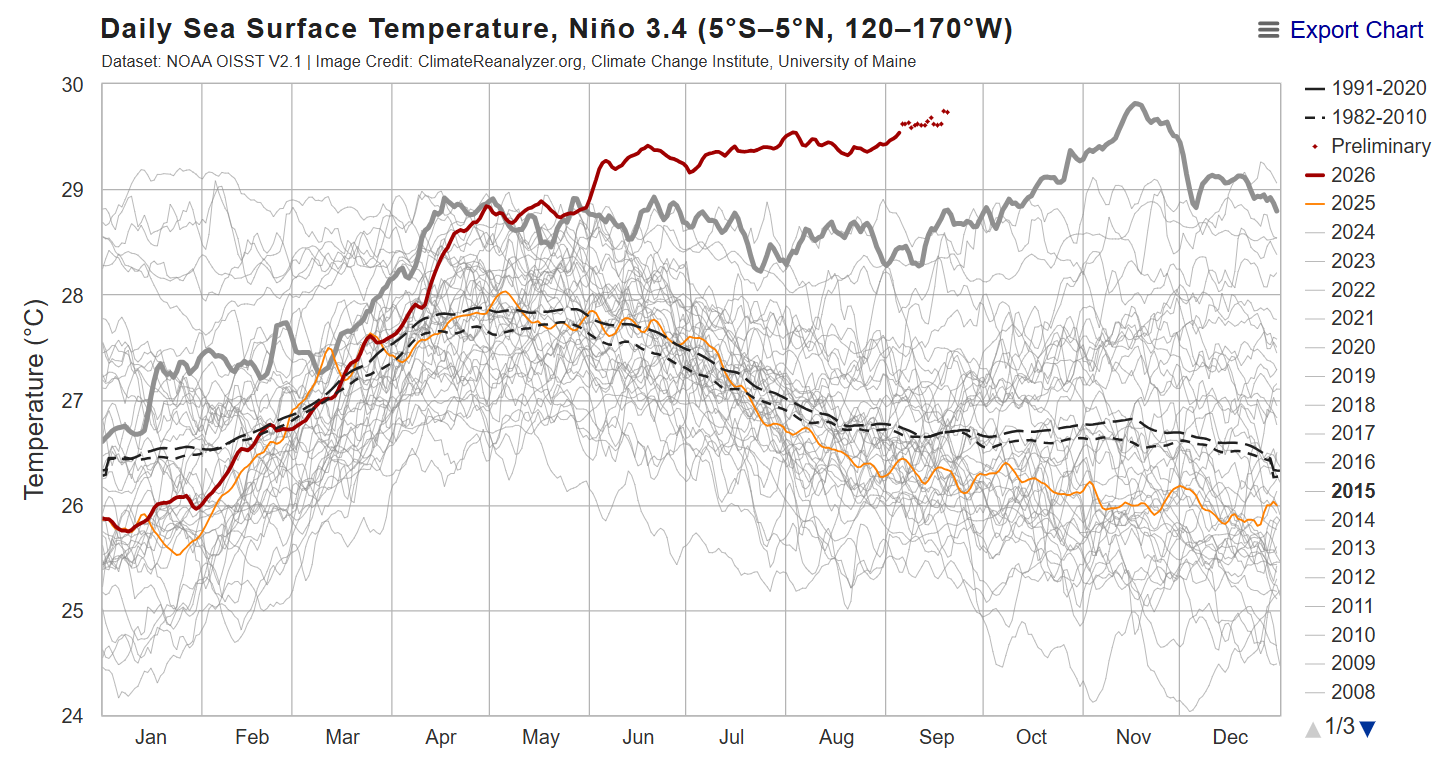
Daily Sea Surface Temperatures. Nino 3.4 Region
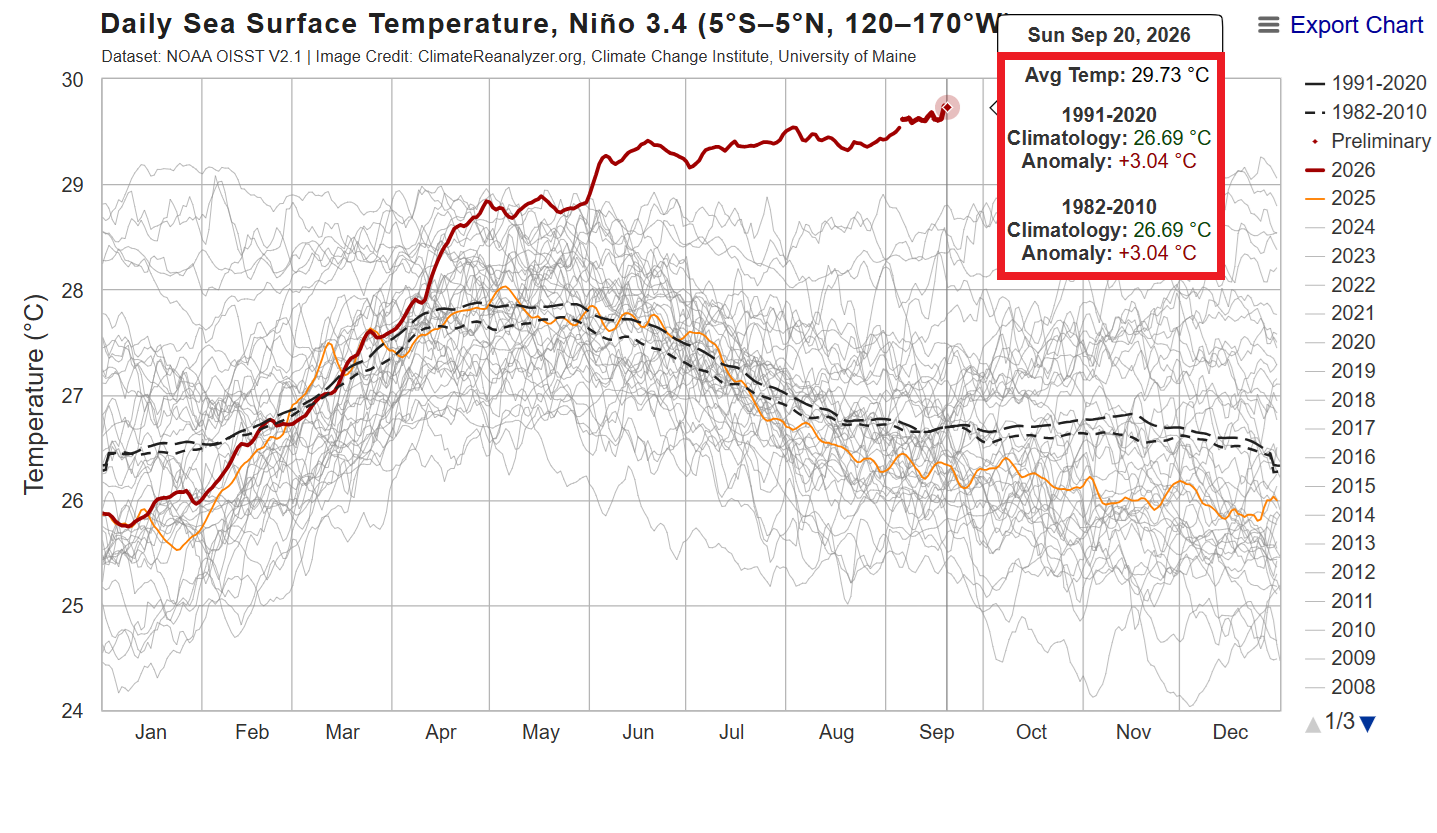 Daily Sea Surface Temperature Nino 3.4 Region
A rapid transition from La Nina to El Nino
The speed of the transition is another important part of the story. Earlier in 2026, the tropical Pacific was still transitioning out of La Niña conditions. By late spring, the Pacific had moved into ENSO-neutral territory, followed by a rapid warming trend through the summer.
The result has been a strengthening coupled ocean-atmosphere pattern characteristic of El Niño. NOAA reports enhanced convection and rainfall across the central and eastern Pacific, suppressed convection over Indonesia, negative Southern Oscillation Index values and significant subsurface warmth beneath the equatorial Pacific. El Niño events typically reach their maximum strength between roughly October and February, making the current level of warmth particularly notable this early in the traditional development cycle.
Subsurface temperatures have also been exceptionally warm, with anomalies exceeding +10°C at depth in parts of the equatorial Pacific.
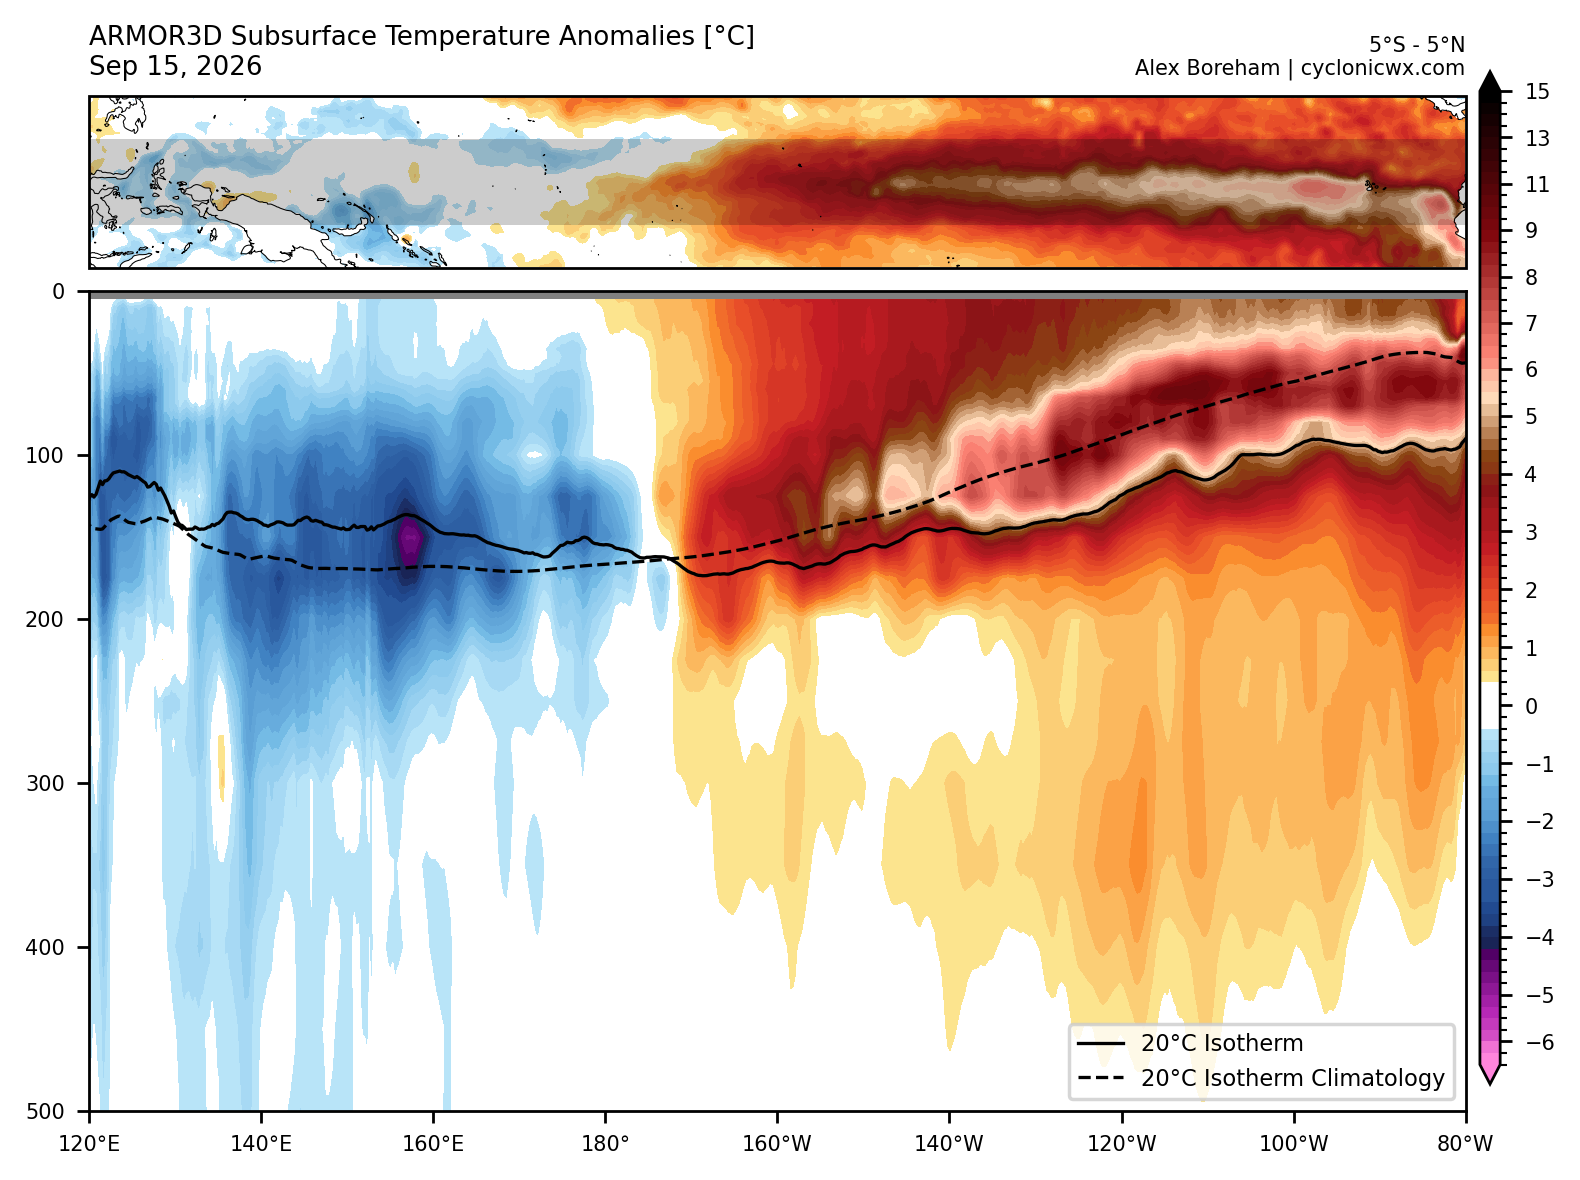
Sub-Surface Temperature Anomalies – CyclonicWX Alex Boreham
What does the El Niño forecast show?
The latest NOAA forecast continues to point toward additional strengthening through the end of 2026. The CPC gives El Niño a greater than 90% chance of reaching very strong strength during the Northern Hemisphere fall and winter. The forecast also gives a 75% chance that the October-December period reaches a historic intensity of +2.5°C or greater using the RONI index.
The forecast is not simply based on one computer model. NOAA incorporates multiple dynamical and statistical models, including the North American Multi-Model Ensemble, CFSv2 and international model guidance, along with historical analogs and observations.
There are also some important differences between 2026 and the other major El Niño events. NOAA notes that the Pacific Decadal Oscillation (PDO) is currently negative, while the major 1982-83, 1997-98 and 2015-16 events occurred with a positive PDO. That difference could modify some of the typical El Niño impacts across the United States.
According to Columbia Climate School, Columbia University, some of the model average bring SST Anomalies to nearly +3.5C with a few hinting at readings exceeding +4.0C as we head deeper in to Fall and Winter.
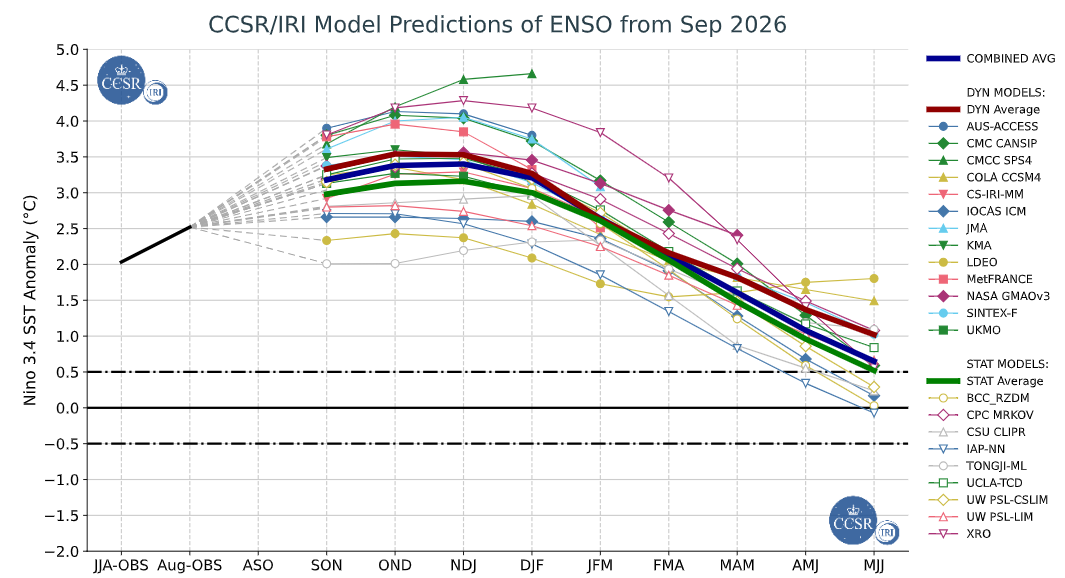
ENSO Forecast Models
El Niño and the unusually quiet Atlantic hurricane season
The developing El Niño is also playing a role in the remarkably quiet Atlantic hurricane season. As of September 21, the Atlantic has produced six named storms but no hurricanes. That has resulted in the latest first-hurricane date on record during the modern observational era.
One of the most important reasons is the atmospheric pattern associated with El Niño. Strong El Niño events tend to increase upper-level winds across the Atlantic Basin, producing greater vertical wind shear. That can disrupt developing tropical systems and make it more difficult for storms to organize and strengthen. NOAA’s hurricane outlook specifically noted that the strengthening El Niño was expected to suppress Atlantic tropical activity.
This is particularly notable because Atlantic sea-surface temperatures remain warm. In other words, the ocean has provided some fuel for tropical systems, but the atmospheric environment has frequently been unfavorable for development.
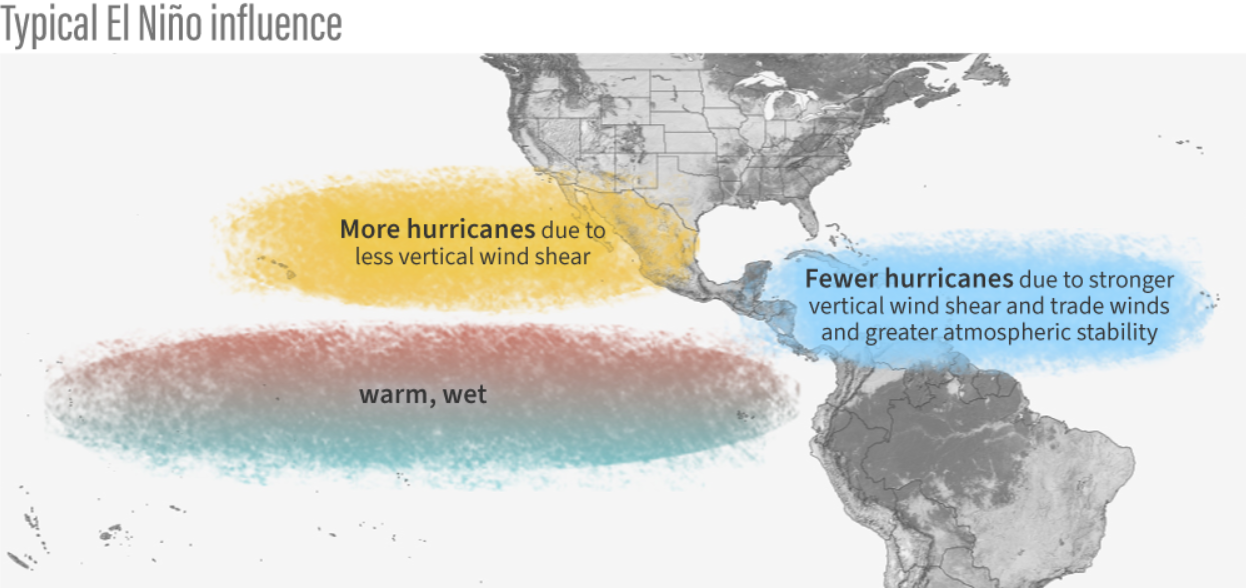
Typical Conditions During El Nino – NOAA
What could El Niño mean for winter in the United States?
NOAA’s Climate Prediction Center released its latest long-range outlook on September 17, covering the upcoming fall and winter. The outlook shows a pattern that is broadly consistent with a strong El Niño, but there are some important differences from a textbook El Niño because of the current background climate pattern. For December through February, NOAA favors above-normal temperatures across much of the western, northern and central United States, with the strongest probabilities generally across portions of the northern tier and interior Northwest. The Southeast has a greater likelihood of near-normal temperatures as the cooler El Niño signal competes with longer-term warming trends.
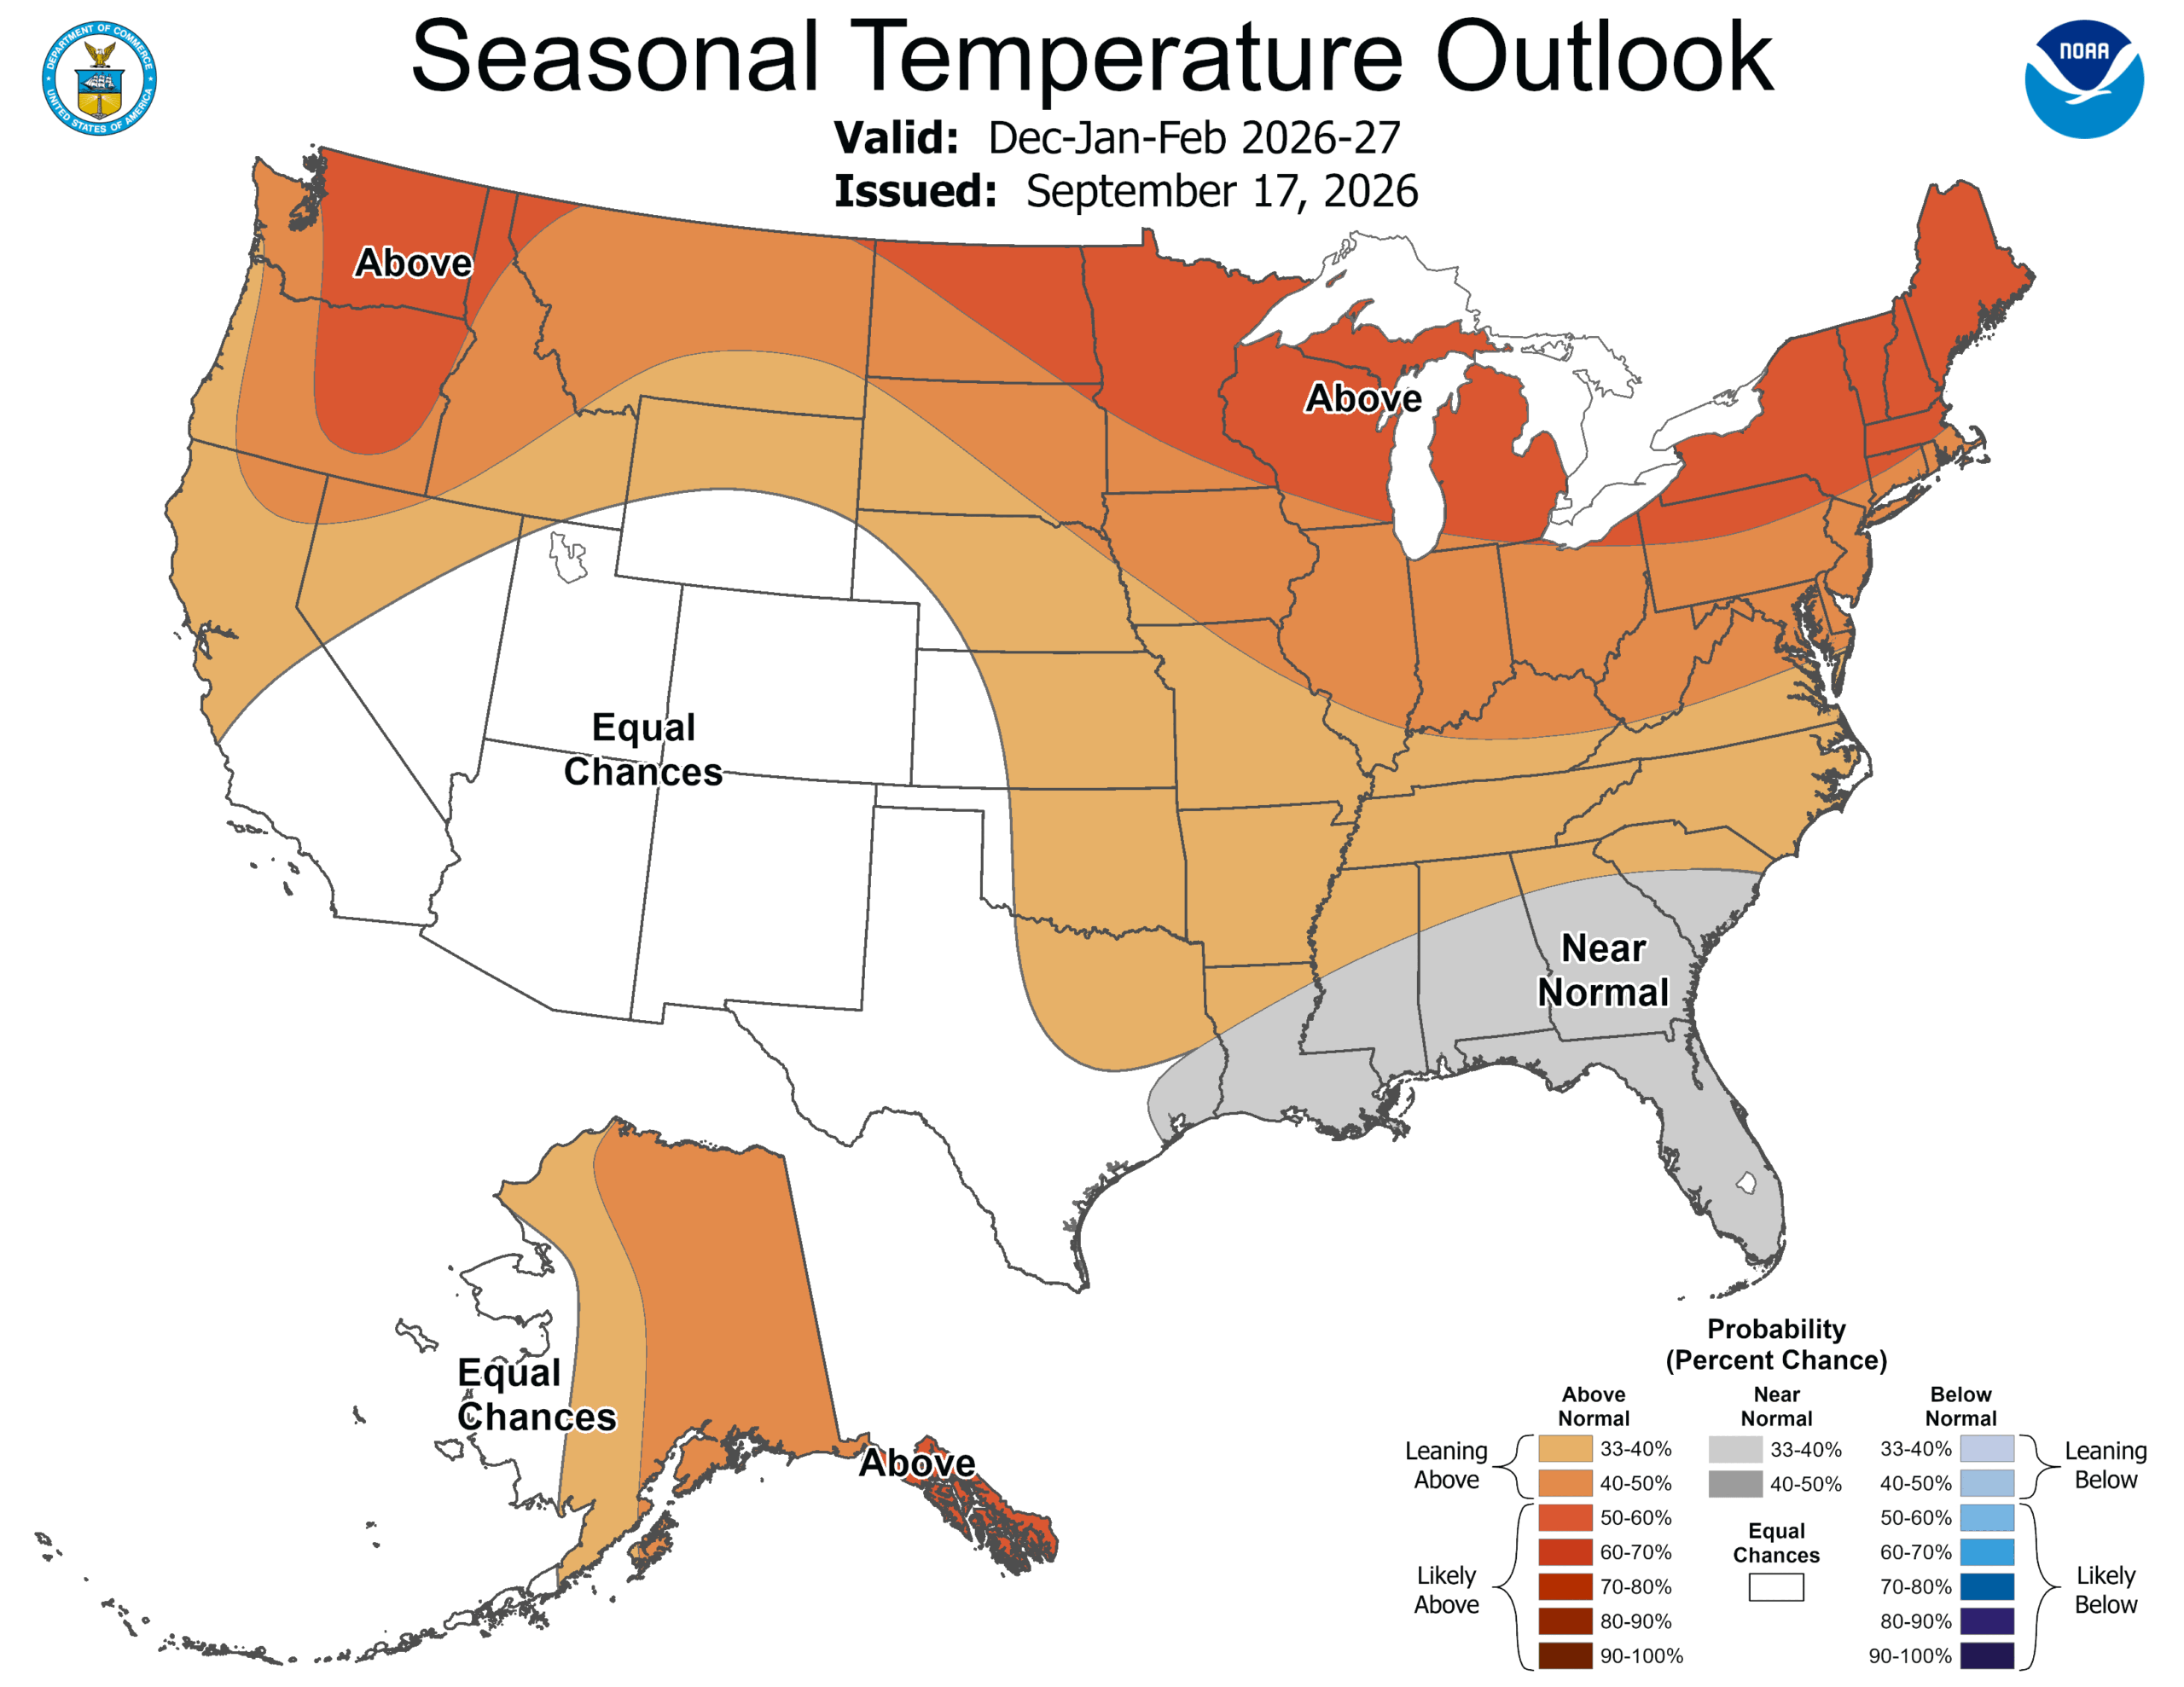
December-January-February Temperature Outlook – NOAA CPC
For precipitation, NOAA favors a wetter pattern across much of the southern and central United States, extending from California and the Southwest across the southern Plains and into the Southeast and East Coast. Meanwhile, more modest probabilities for below-normal precipitation extend across portions of the interior Northwest and Great Lakes. The precipitation pattern is closely related to the typical El Niño jet-stream configuration, which favors a stronger subtropical jet and an enhanced storm track across the southern United States.
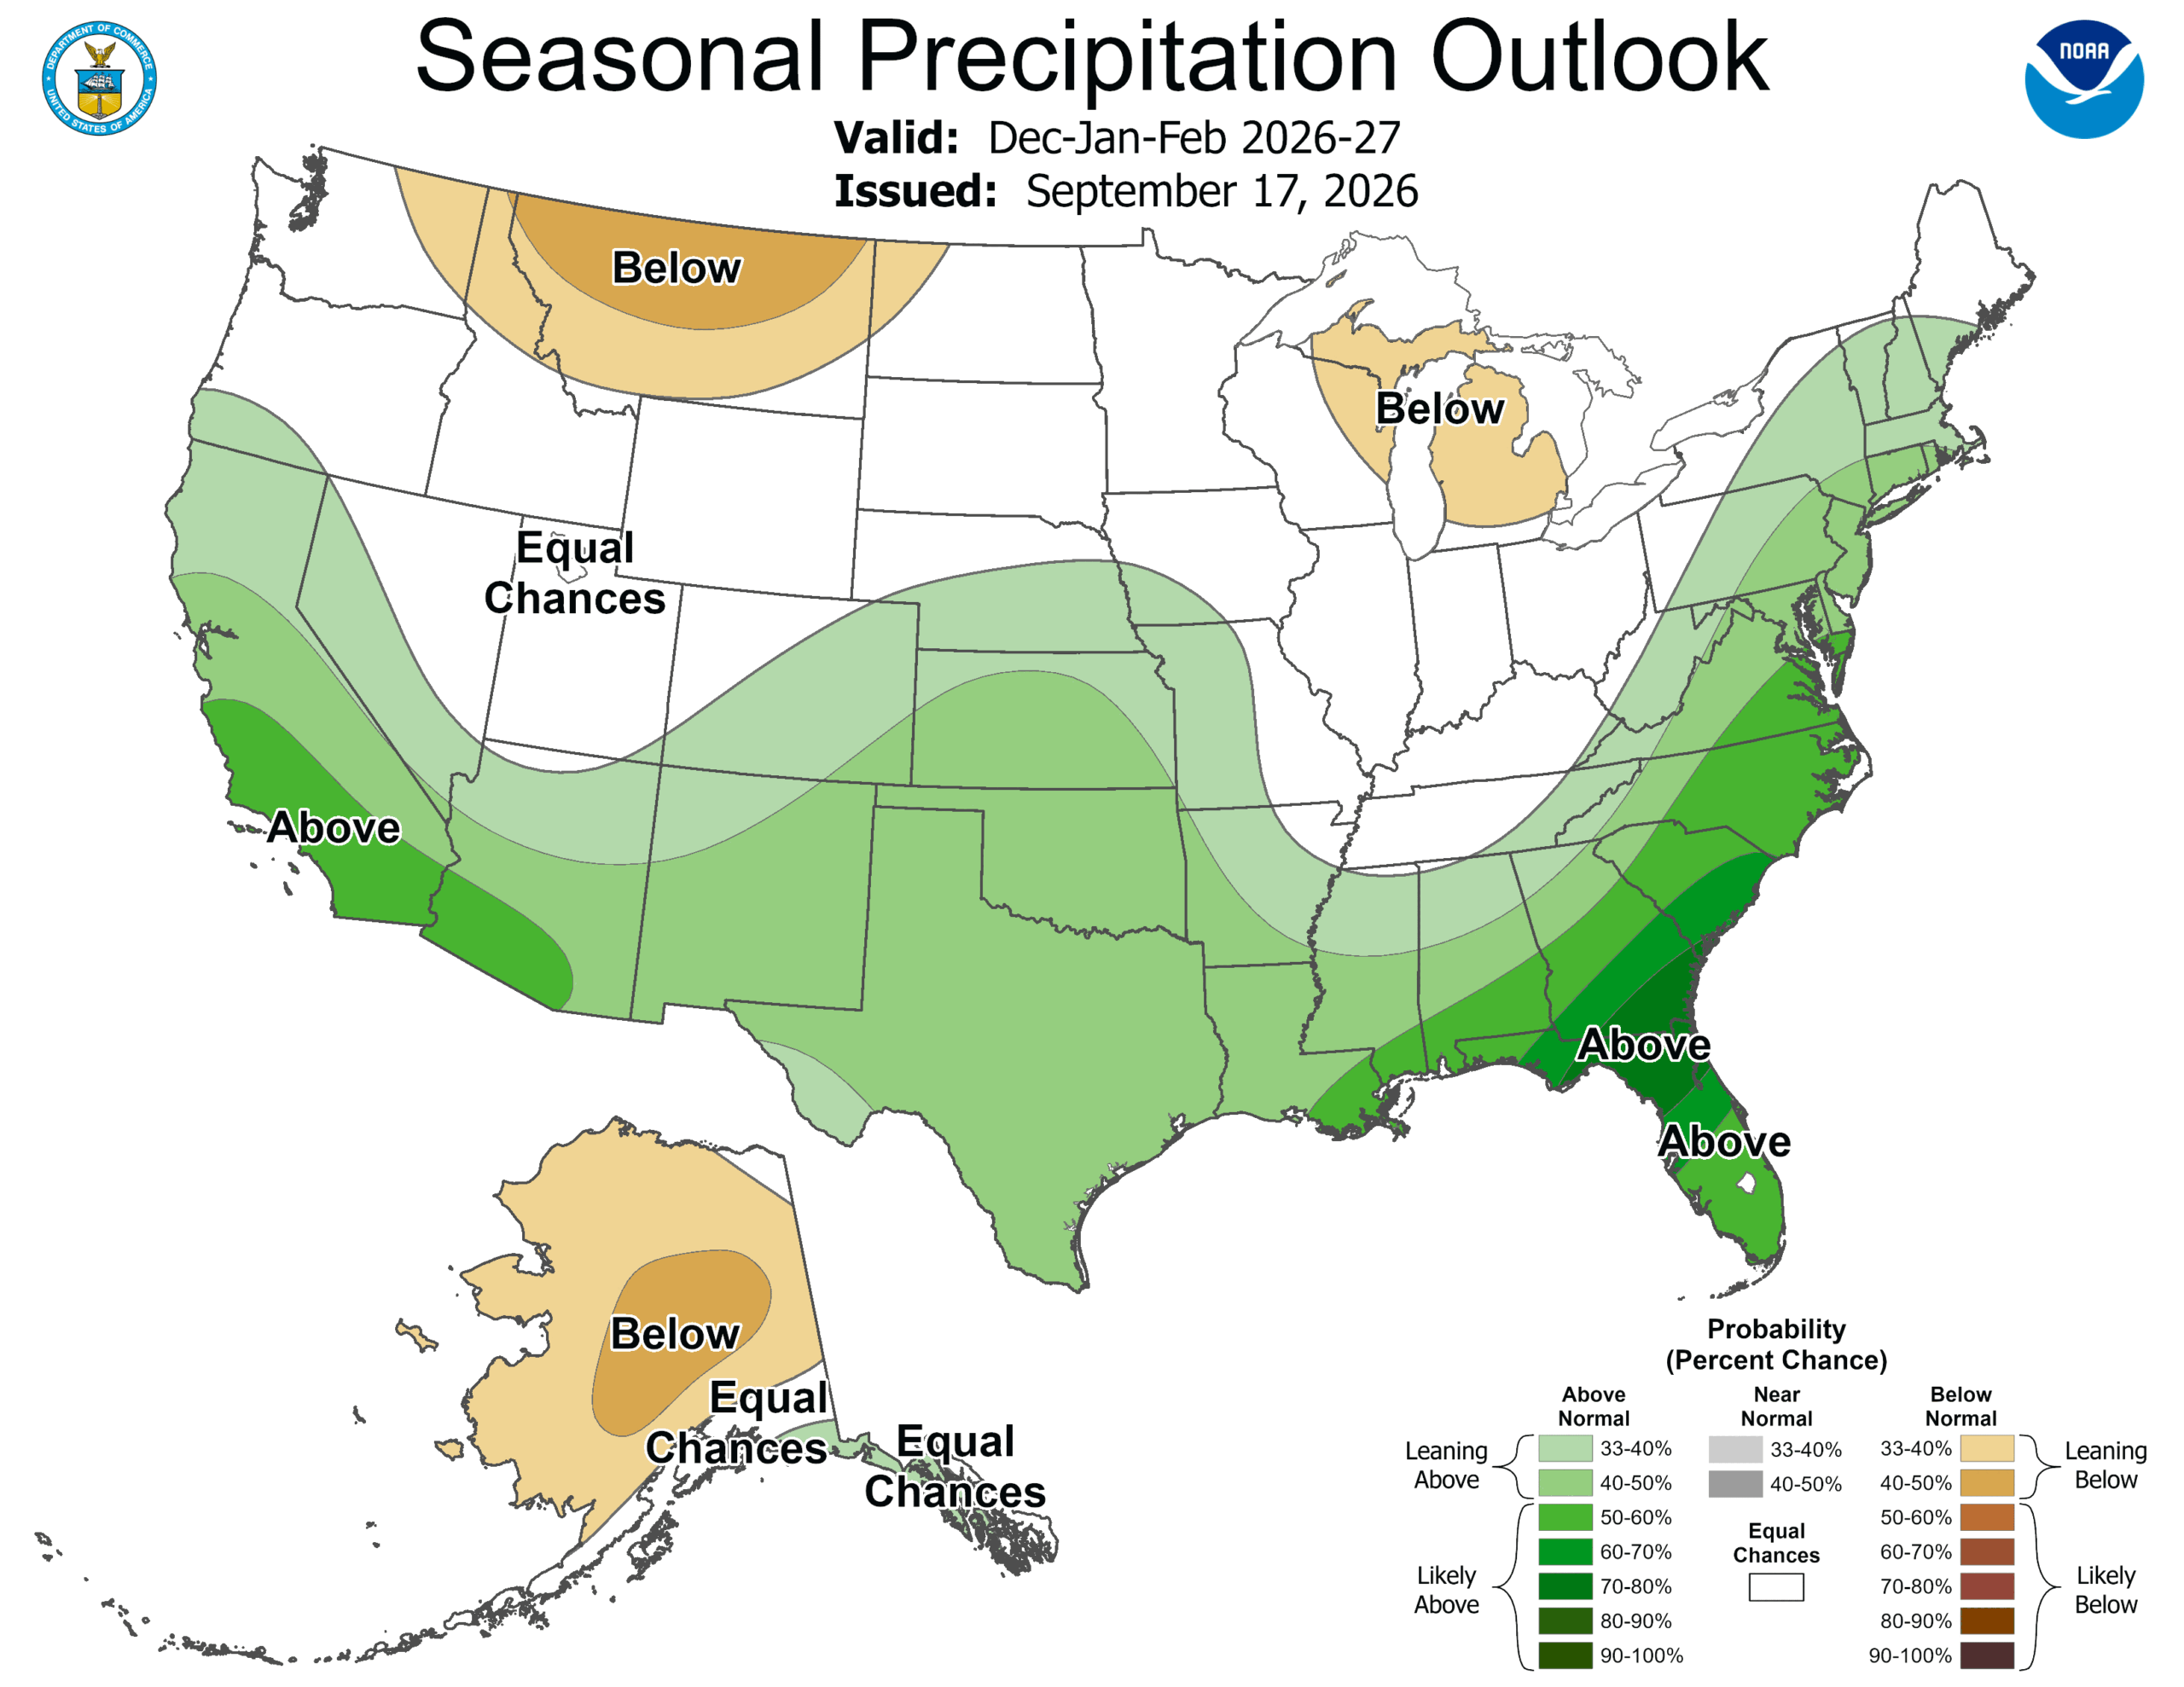
December-January-February Precipitation Outlook – NOAA CPC
What does a typical El Niño winter look like?
While every El Niño is different, there are recognizable large-scale patterns that occur more frequently during El Niño winters. The northern United States generally has a greater tendency toward warmer-than-average temperatures, while the southern tier tends to be cooler and wetter. California and portions of the Southwest frequently see increased precipitation, while the Pacific Northwest and portions of the northern United States can trend drier.
The primary driver is the response of the jet stream to the warmer tropical Pacific Ocean. El Niño shifts tropical rainfall and atmospheric circulation, which in turn influences the position and strength of the Pacific and subtropical jet streams. However, a typical pattern is not a guarantee.
Other factors, including the Arctic Oscillation, North Atlantic Oscillation, Pacific Decadal Oscillation and shorter-term weather patterns, can significantly alter the eventual outcome of any individual winter. NOAA specifically notes that the negative PDO this year could dampen some of the traditional strong-El Niño signals in parts of the country.
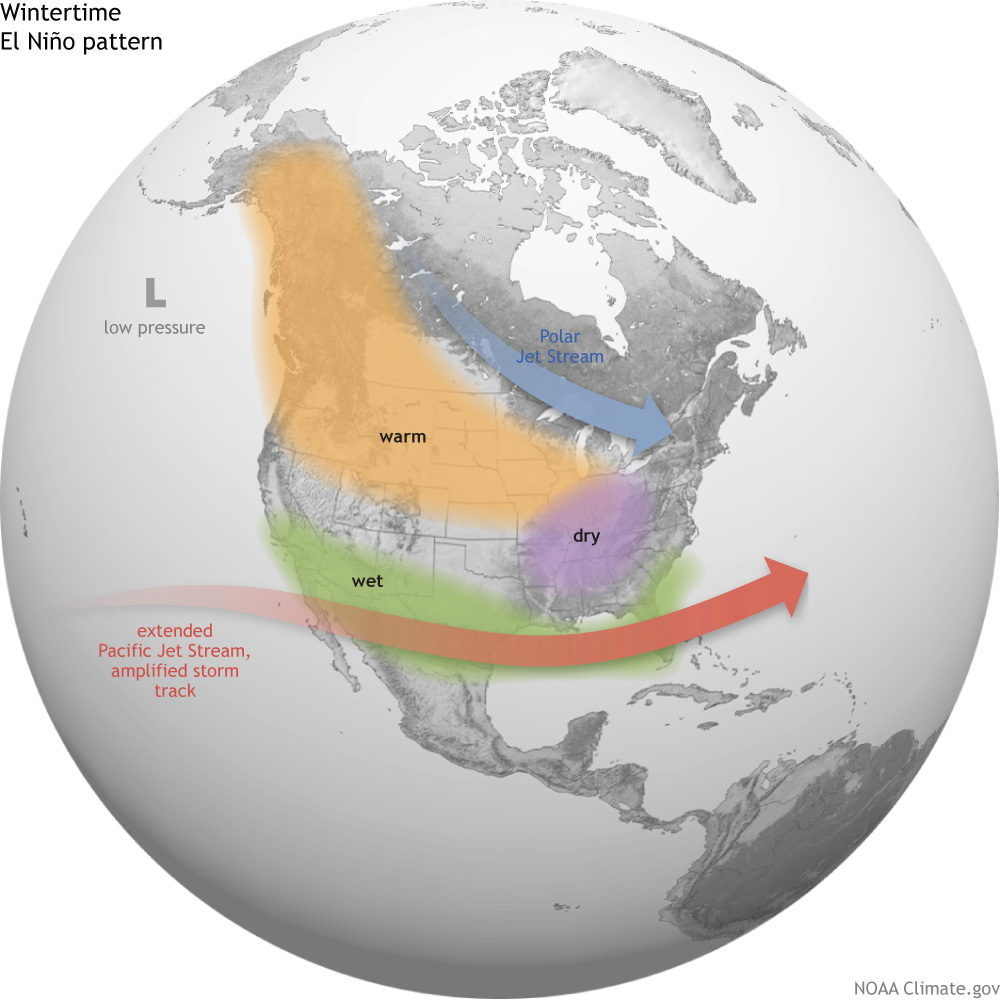
Typical El Nino Winter Pattern
What to watch heading into winter
The 2026-27 El Niño will be closely monitored over the coming months for several reasons. First, the event has strengthened unusually quickly and is already exceptionally strong. Second, the current forecast calls for additional strengthening into late fall and early winter. And third, the background atmospheric and oceanic conditions are not identical to those observed during the strongest El Niño events of the past.
For businesses, utilities, agriculture, transportation and other weather-sensitive industries, the most important takeaway is that El Niño provides a large-scale climate signal, not a specific day-to-day forecast. Seasonal outlooks describe changes in the probability of temperature and precipitation categories over several months. They cannot determine whether a particular city will experience a snowstorm, ice storm, cold outbreak or unusually warm stretch weeks or months in advance.
As winter approaches, shorter-range forecasts will increasingly become more useful for specific weather events, while the broader El Niño pattern can provide important context for the overall seasonal environment. Praedictix will continue monitoring the evolution of this exceptional El Niño and its potential impacts across the United States throughout the fall and winter.
See more from Praedictix.com