

The Limits of Long Range Forecasting
“Paul, please help. My little girl is having an outdoor wedding on October 11. Any idea what the weather will be?” Yes I do. Changeable. It might be easier to predict where the stock market will be on October 11.
There is (some) forecast skill going out 1-2 weeks for a specific location. Beyond that it’s mostly hand-waving and ruminating about trends. The reason? Chaos Theory.
Over 210 million current observations from weather stations, balloons, satellites, ships and planes provide the raw fuel for weather models that simulate what the atmosphere SHOULD look like in the future. The harsh reality? A butterfly fluttering its wings in Japan MIGHT impact the weather thousands of miles downwind; tiny errors and omissions become magnified over time and computers become useless after a couple of weeks. In spite of faster supercomputers we don’t yet have the technology to peer out, with any
accuracy, beyond 2 weeks. Sobering, but true.
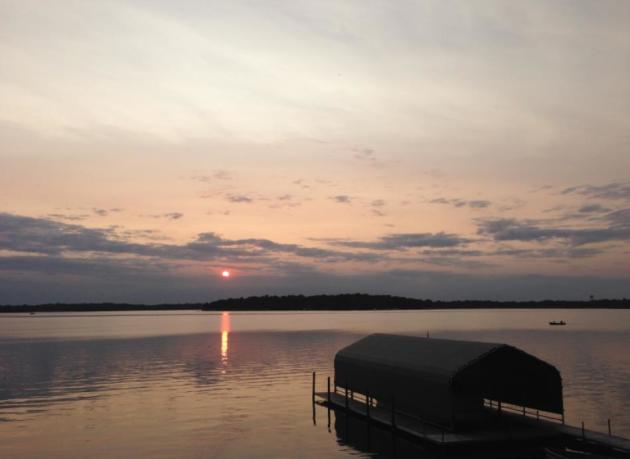
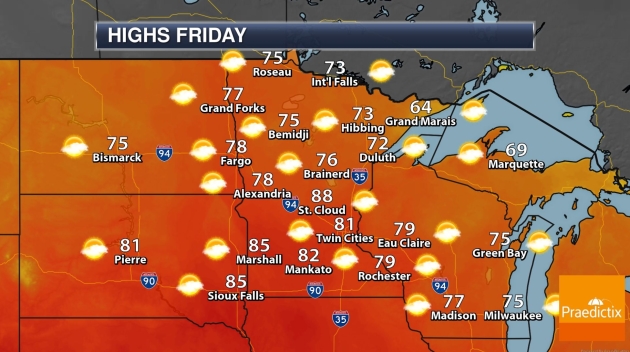
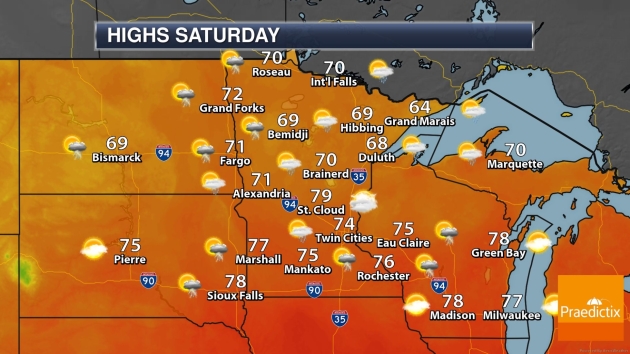
The Autumnal Equinox is today, but summerlike warmth spills into Friday, before a vigorous cold front sparks Saturday showers, and a decided turn toward jackets next week.
Is that it for summer sweat? Not so fast. Long-range models predict a warm surge here in early October.
Then again, buyer beware.
Photo credit: Pete Schecnk on Lake Ossawinnamakee.
A Windier Than Average Summer Across Minnesota. Dr. Mark Seeley confirms our intuitions at Minnesota WeatherTalk: “…Looking at the climate data for May through August in the Twin Cities shows that 2020 did generally bring higher average daily wind speeds, and a higher than normal frequency of days with wind gusts over 30 mph. Only the month of July brought less than average daily wind speeds on most days. June was the windiest month of the summer and had 23 days with wind gusts over 30 mph. There were 21 days during the growing season when wind gusts exceeded 40 mph, and on August 10th and 14th wind gusts peaked briefly over 60 mph. These are indeed higher numbers and may partially be caused by the polar jet stream taking up position over the Minnesota landscape more frequently this summer...”

Ever Wonder Why Trees Ditch Their Leaves Every Fall? The Washington Post (paywall) has a good explainer geared toward kids; here’s an excerpt: “…Trees are solar-powered. Each leaf is loaded with a pigment called chlorophyll (pronounced CLORE-o-fill), which absorbs light and helps convert water and carbon dioxide into energy. The process is called photosynthesis (fo-toe-SYN-thuh-sis). But there’s a problem. In parts of the world that experience seasons, winter means less and less sunlight each day. It also comes with biting cold that can freeze the liquids inside leaves. These two factors hamper the tree’s ability to make energy. A full-grown oak tree might have more than 60,000 leaves, and each one requires valuable nutrients. So when fall turns into winter, trees discharge their leaves as a cost-cutting measure. If it had to spend resources on all those leaves through the winter, not only would the leaves freeze, but the tree would die...”
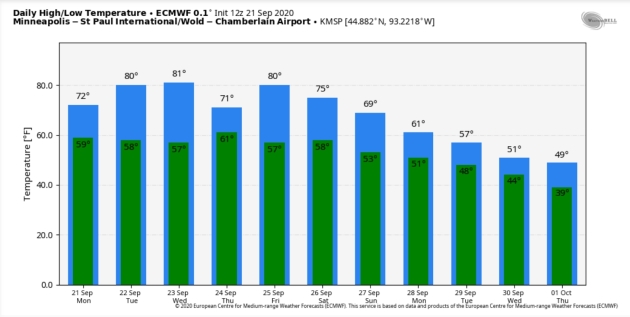
Cool Correction Next Week. ECMWF (above) shows a few days in the 50s next week – I wouldn’t be surprised to see fairly widespread frost by the middle of next week before another warming trend kicks in the first week of October. Meteogram for MSP: WeatherBell.

“Crazy” 2020 Hurricane Season Matches 2005 in Activity, But Not Storm Intensity. Some perspective from USA TODAY: “…The big difference between the two seasons, Sudduth said, is “we haven’t had the very long lasting, powerful hurricanes like we did in ’05.” In that regard, Klotzbach said, it’s unlikely 2020 will catch up to 2005. In terms of the intensity and duration of the strongest storms, 2020 is unlikely to equal 2005, Klotzbach said. By the end of 2005, the accumulated cyclone energy – measured by the intensity and duration of all the storms combined – was 250, he said. Right now, the Atlantic’s accumulated energy is around 90…”

Praedictix Briefing: Issued: Monday morning, September 21st, 2020:
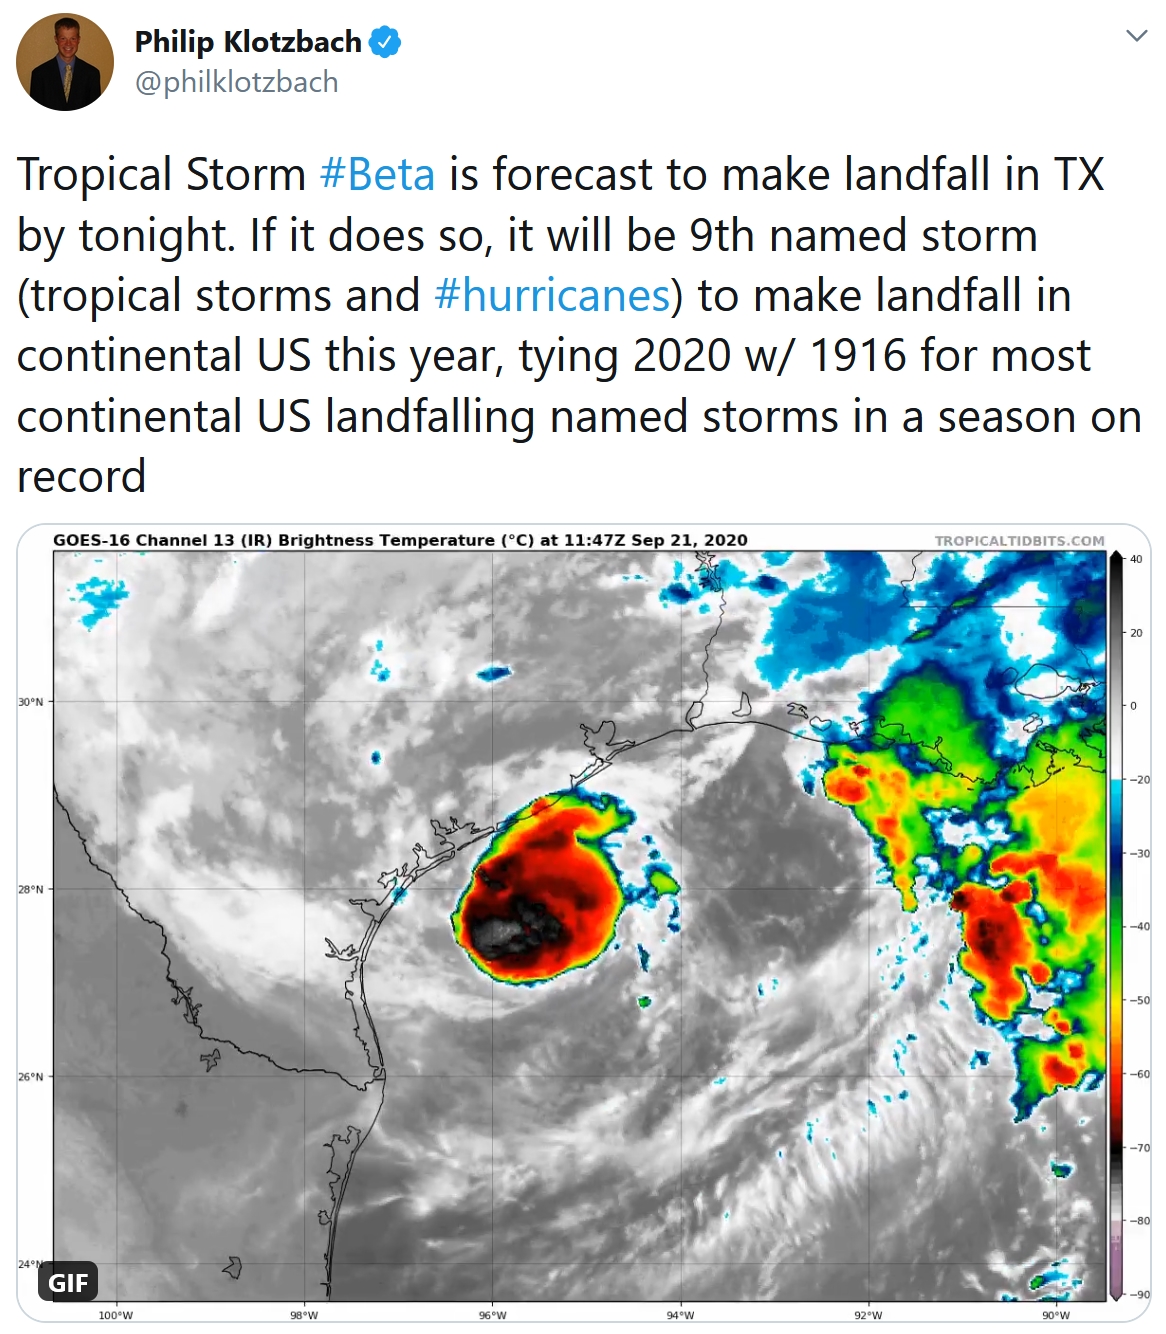
Tropical Storm Beta
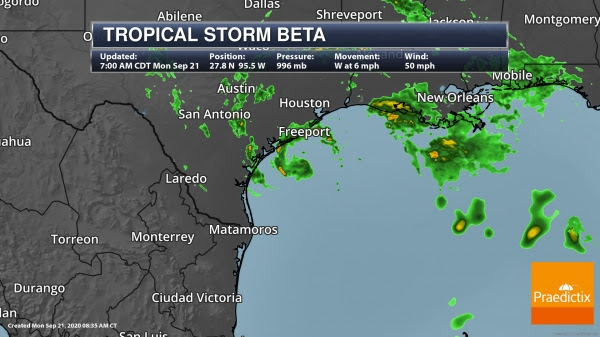
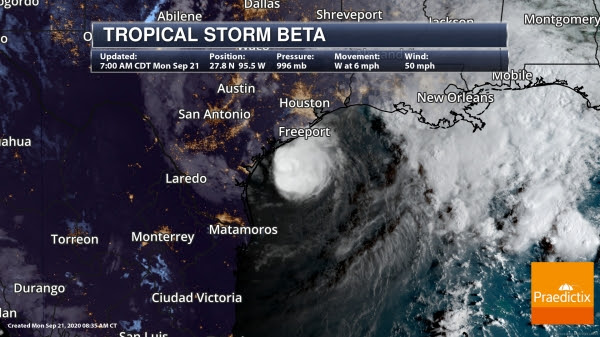
Beta Is Struggling. It appears that Beta, sitting not even a hundred miles off the Texas coast, is struggling a bit this morning as showers/storms and winds associated with the system have decreased. Dry and stable air has been wrapped into the system, and upper level winds remain strong, preventing any strengthening. As of 7 AM CDT, the center of Sally was about 70 miles southeast of Port O’Connor, TX, or 120 miles south-southwest of Galveston, TX, and moving west at 6 mph. Beta had 50 mph winds and tropical-storm force winds extend outward 175 mph, mainly on the north side of the system.
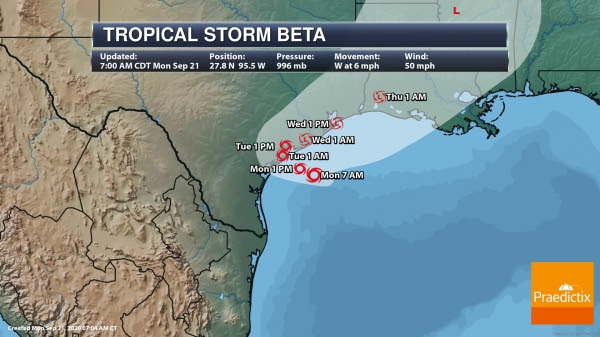
Beta Track. Beta will slowly continue to move off to the west/west-northwest today into tonight, which will bring Beta to the Texas coast tonight along or south of Matagorda Bay. Many models show Beta slowing down even more or stalling out near/just inland over Texas Tuesday before an approaching system finally kicks Beta off to the northeast late Tuesday into Wednesday and Thursday. Due to unfavorable atmospheric conditions, and eventually its proximity to land, additional strengthening is not expected, with weakening expected through the middle of the week. It should become post-tropical by Friday.
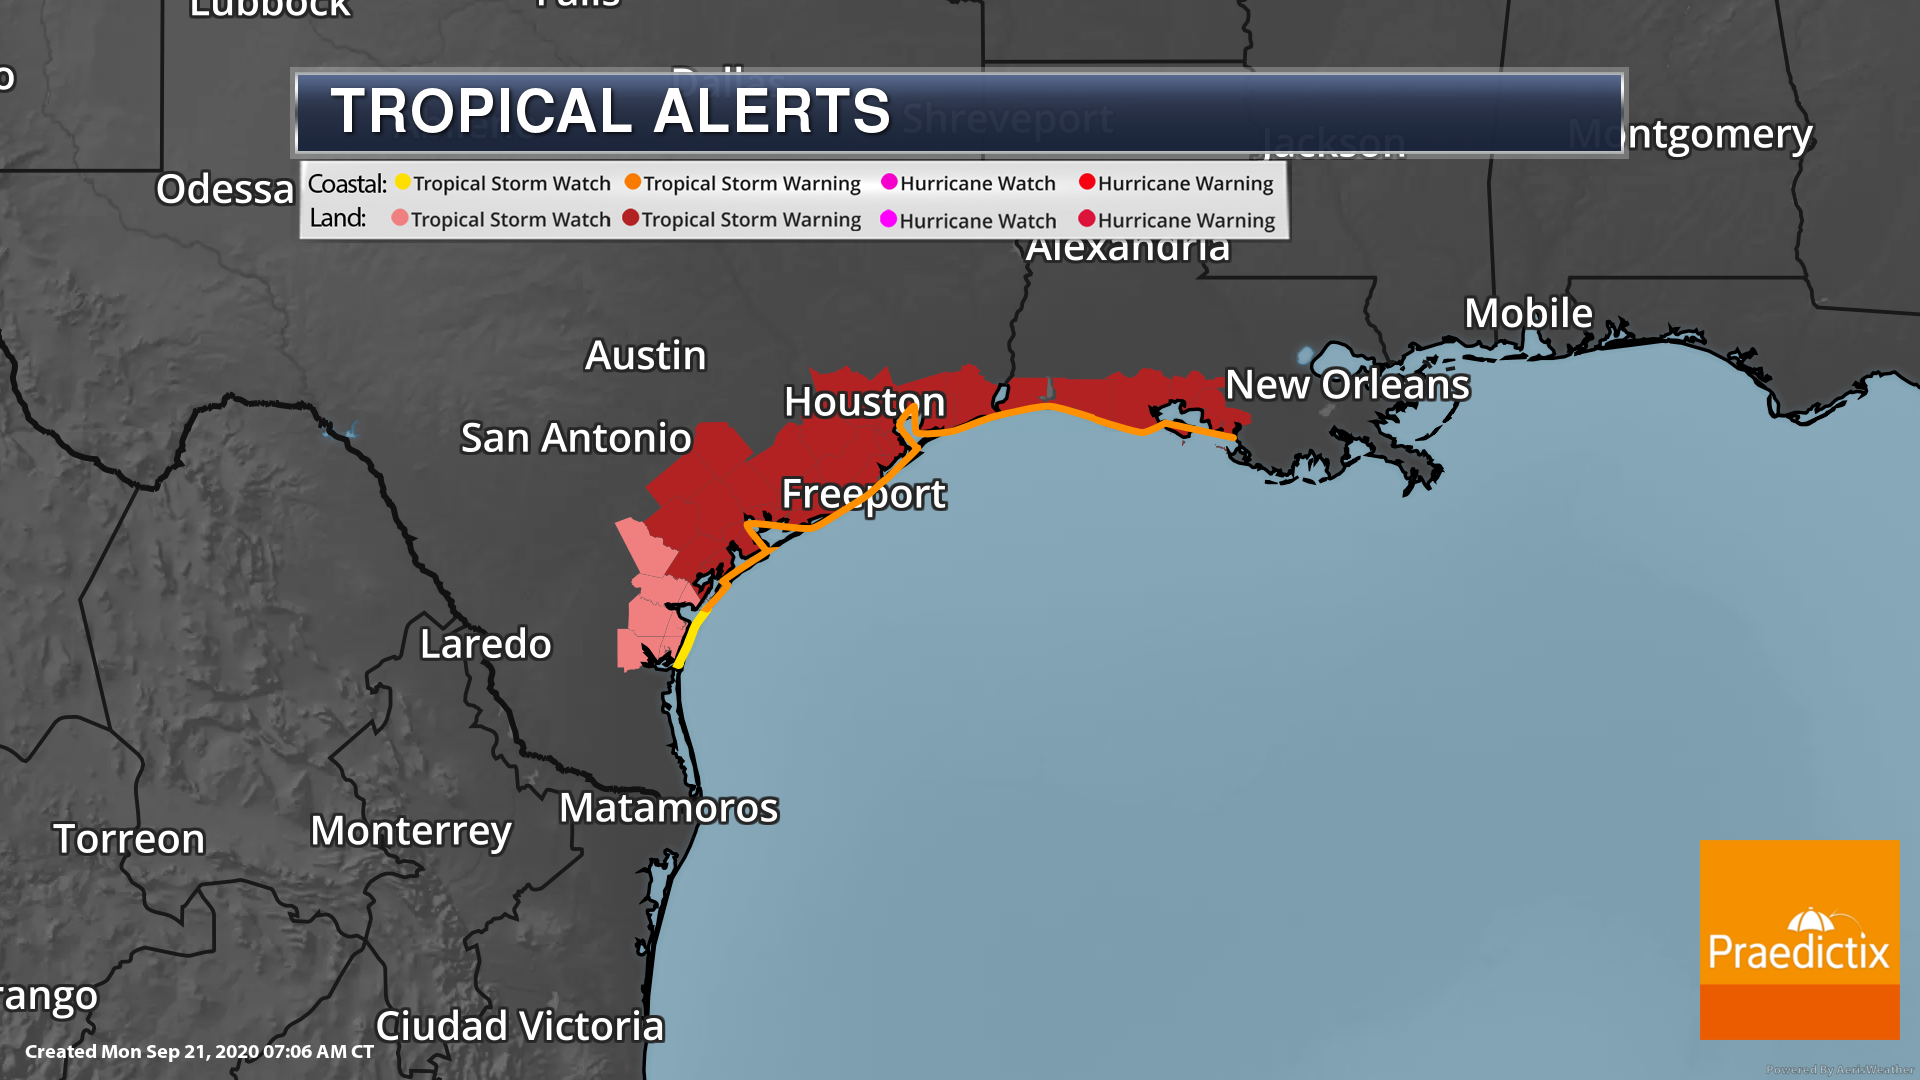
Tropical Storm Watches and Warnings. With Beta approaching the western Gulf Coast, Tropical Storm Watches and Warnings have been issued inland and along the coast. Cities that are under Tropical Storm Warnings include Houston, Galveston, Beaumont, and Victoria (TX), as well as Morgan City (LA). Tropical Storm Watches include Corpus Christi. Here are where these watches and warnings are in place along the coast:
A Tropical Storm Warning is in effect for…
* Port Aransas Texas to Morgan City Louisiana
A Tropical Storm Watch is in effect for…
* Baffin Bay to Port Aransas Texas
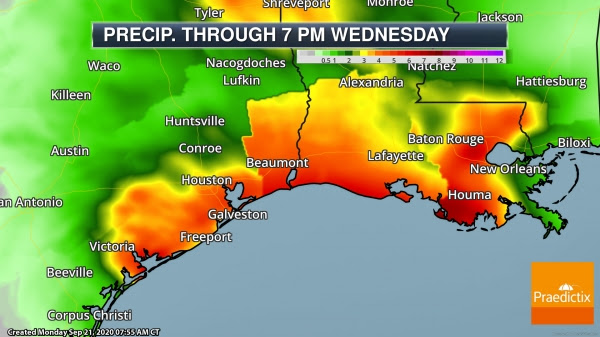
Heavy Rain. One of the main risks with Beta will be heavy rain across portions of Texas and Louisiana. Near and along the track of Beta, rainfall amounts of at least 5-10” (isolated 15” amounts) are possible from the middle Texas coast to southeastern Louisiana. This heavy rain could lead to flash flooding across the region. 3-5” are possible from Beta north of these regions up into the ArkLaTex and east into the lower Mississippi Valley.
Flooding Expected. Due to the heavy rain threat, flash flooding is expected the next few days across portions of Texas and Louisiana. Today/tonight the greatest risk is along the middle and upper Texas Coast, where widespread one-day totals of 3-6”+ are expected with hourly rainfall rates of up to 3” possible. On Wednesday, models are showing a band of rain occurring across portions of southeastern Louisiana with hourly rainfall rates of 2”+ possible. This could lead to rainfall amounts of 5”+ in a day, which will lead to flooding.
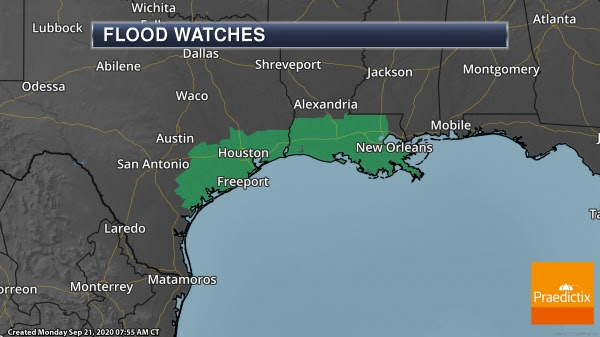
Flood Watches. Due to the heavy rain threat, Flood Watches are in place from the mid-Texas coast to southern Louisiana.

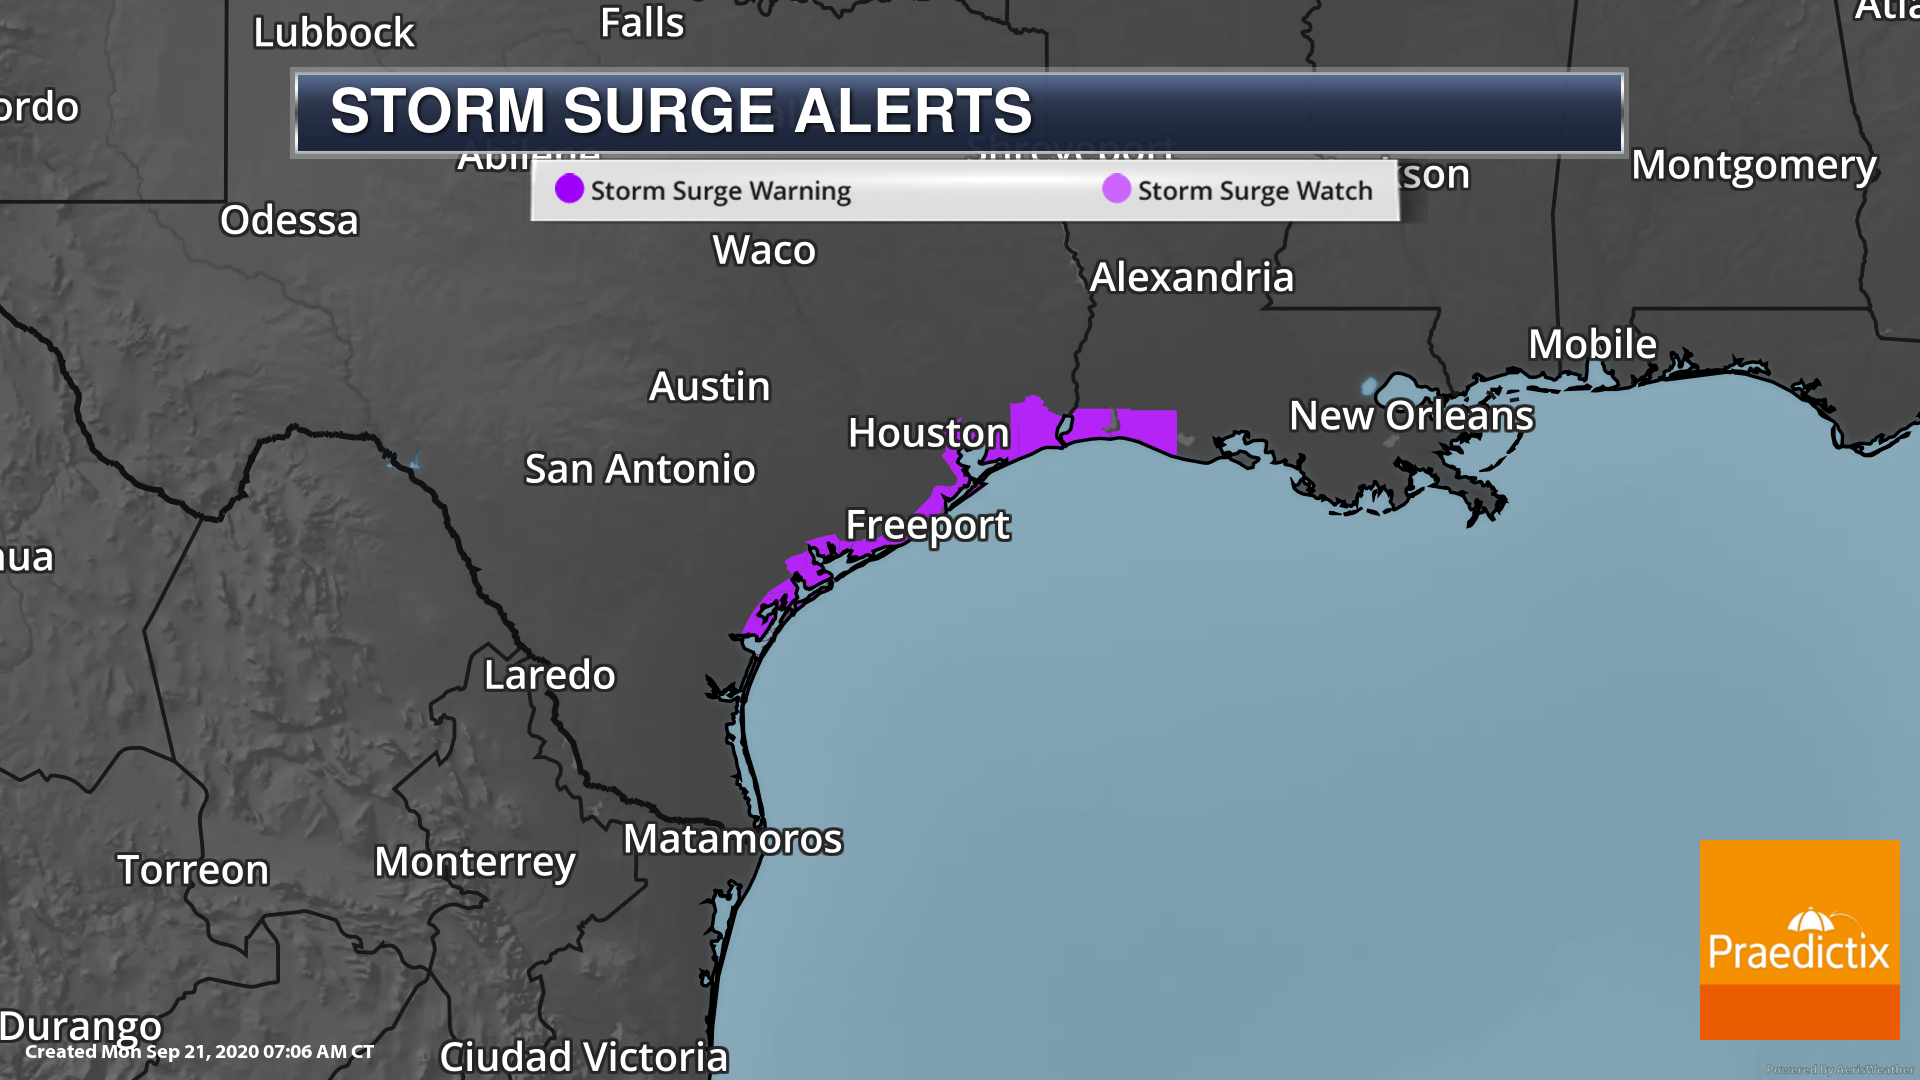
Storm Surge Threat. Beta will continue to produce a storm surge threat over the next few days, with coastal flooding already ongoing this morning. The combination of the storm surge and tide will cause normally dry areas to be flooded by water moving inland from the Gulf of Mexico. The following levels could be reached if the peak surge occurs at high tide:
- San Luis Pass, TX to Sabine Pass, TX including Galveston Bay…3-5 ft
- Port Aransas, TX to San Luis Pass, TX including Copano Bay, Aransas Bay, San Antonio Bay, and Matagorda Bay…2-4 ft
- Sabine Pass, TX to Rockefeller Wildlife Refuge, LA including Sabine Lake and Calcasieu Lake…2-4 ft
- Rockefeller Wildlife Refuge, LA to Ocean Springs, MS including Vermilion Bay, Lake Borgne, Lake Pontchartrain, and Lake Maurepas…1-3 ft
- Baffin Bay, TX to Port Aransas, TX including Corpus Christi Bay and Baffin Bay… 1-3 ft
- Mouth of the Rio Grande to Baffin Bay, TX…1-2 ft
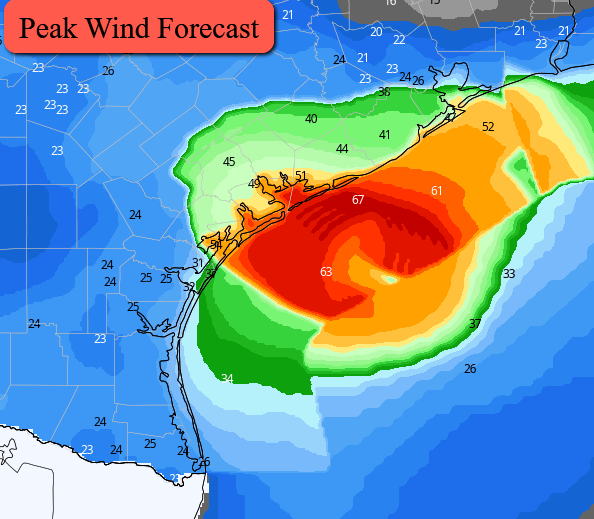
Peak Winds. The strongest winds – up to around 50 mph – are expected along the Texas coast, particularly near where the center makes landfall. The strongest winds are expected overnight tonight as Beta approaches and makes landfall.
Other Tropical Activity
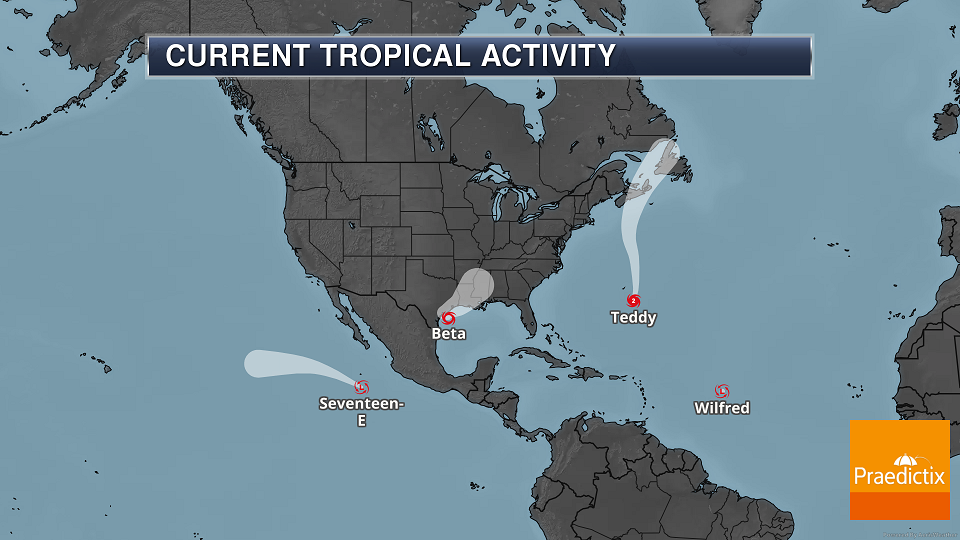
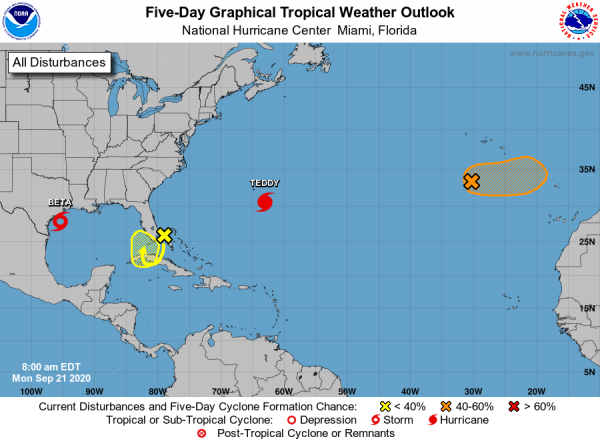
Other Tropical Activity. We are also watching the following systems in the Atlantic:
- Hurricane Teddy: Teddy is moving north-northeast this morning at 9 mph, and will pass east of Bermuda today, approaching Nova Scotia late Tuesday or early Wednesday. Tropical Storm Warnings are in place for Bermuda, with Tropical Storm Watches from Lower East Pubnico to Main-a-Dieu Nova Scotia.
- An area of showers and storms over southeastern Florida and the northwestern Bahamas will linger across the region (as far south as Cuba) though the end of the week. By Thursday and Friday upper levels winds could become somewhat favorable for some development. This system has a 20% chance of formation in the next five days. However, heavy rain will be possible across southern Florida and the Keys through tonight.
- Post-Tropical Cyclone Paulette has a 60% chance of development south of the Azores over the next few days as the system moves eastward.
D.J. Kayser, Meteorologist, Praedictix.

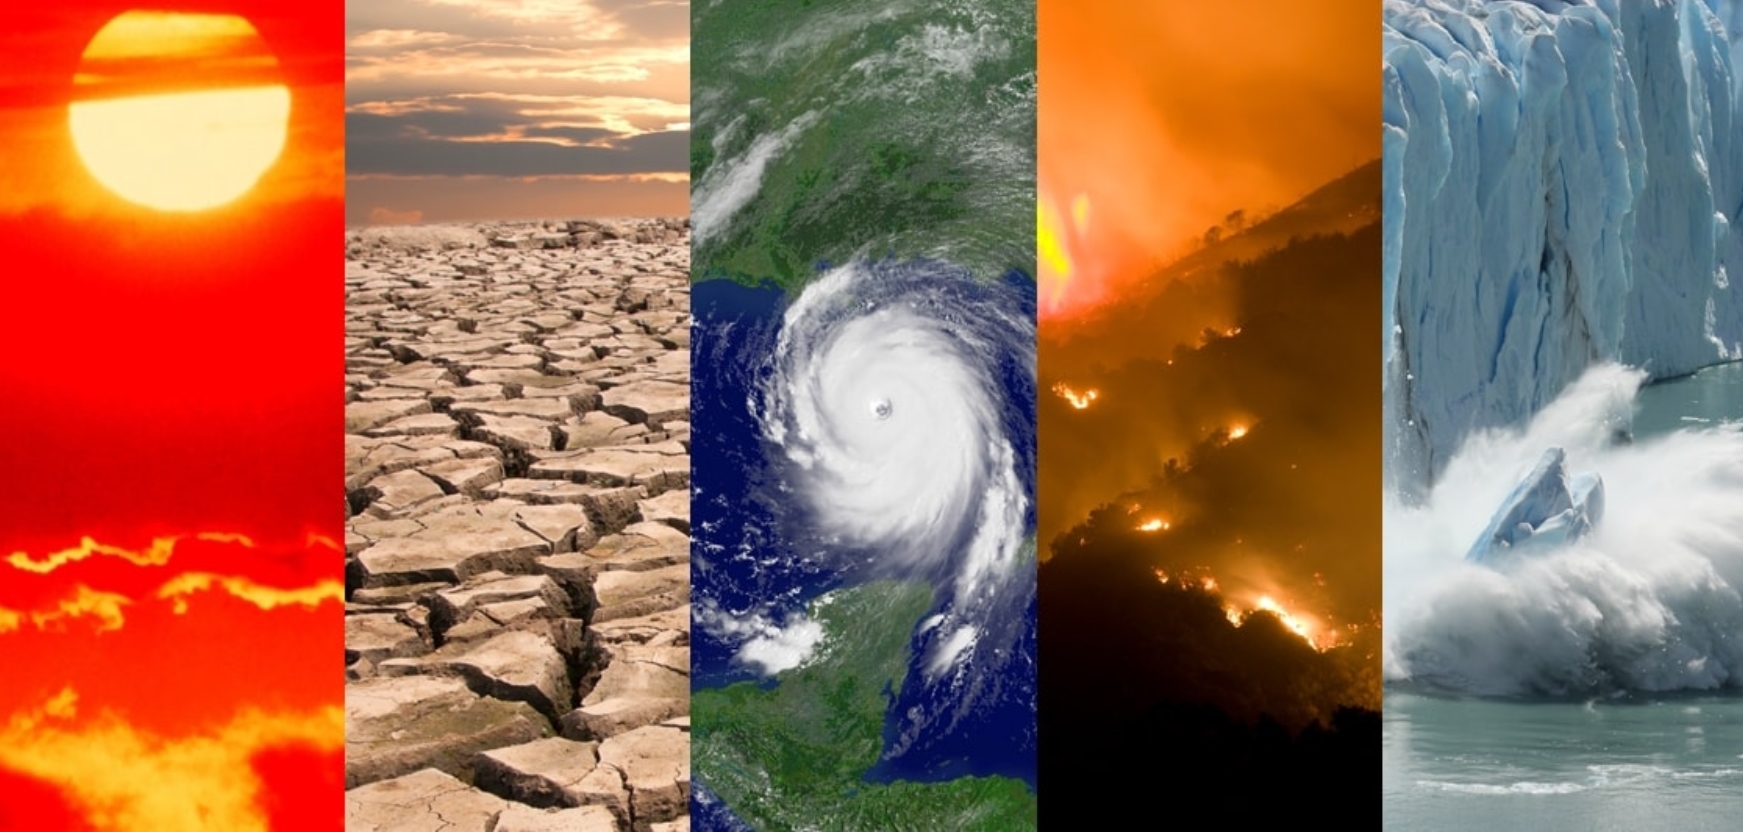
Summer of U.S. Disasters Set Records, Left Trail of Ruins. Bloomberg summarizes some of the biggest weather stories of 2020: “…Other parts of the U.S. saw record temperatures, too. Arizona, California, Colorado, Nevada, New Mexico and Utah all had their warmest August on record. Phoenix had its hottest month ever in August, with an average temperature of 99.1. And it was the hottest July ever across the Northern Hemisphere. Derechos: A line of violent storms known as a derecho cut electricity to more than 1 million customers last month in the U.S. Midwest and destroyed more than 550,000 acres of corn in Iowa. It was 160 miles (260 kilometers) wide, bringing lightning, hail and deadly, 100 mile-per-hour winds that cut a path of destruction across Iowa, Illinois and Indiana. It was one of the most damaging storms ever for Eastern Iowa’s power grid, leaving some areas without power for more than a week...”
File image above: NOAA.

Smoke from Western Fires Reported As Far Away as the Netherlands. Mental Floss has details: “For those not living in California, Oregon, or Washington, the raging wildfires in those states that have consumed more than 4 million acres might seem slightly abstract. But over the past week, the intensity of those blazes, coupled with specific weather patterns, has made it possible for people in New York—and even as far away in Europe as the Netherlands—to look up and see smoke in the skies. According to both NASA and the National Weather Service, jet streams have allowed the smoke to migrate across the Northeast and Mid-Atlantic regions, with the plume strong enough to actually blot out the sun and lower the temperature by a few degrees...”
Monday smoke visualization courtesy of NOAA.
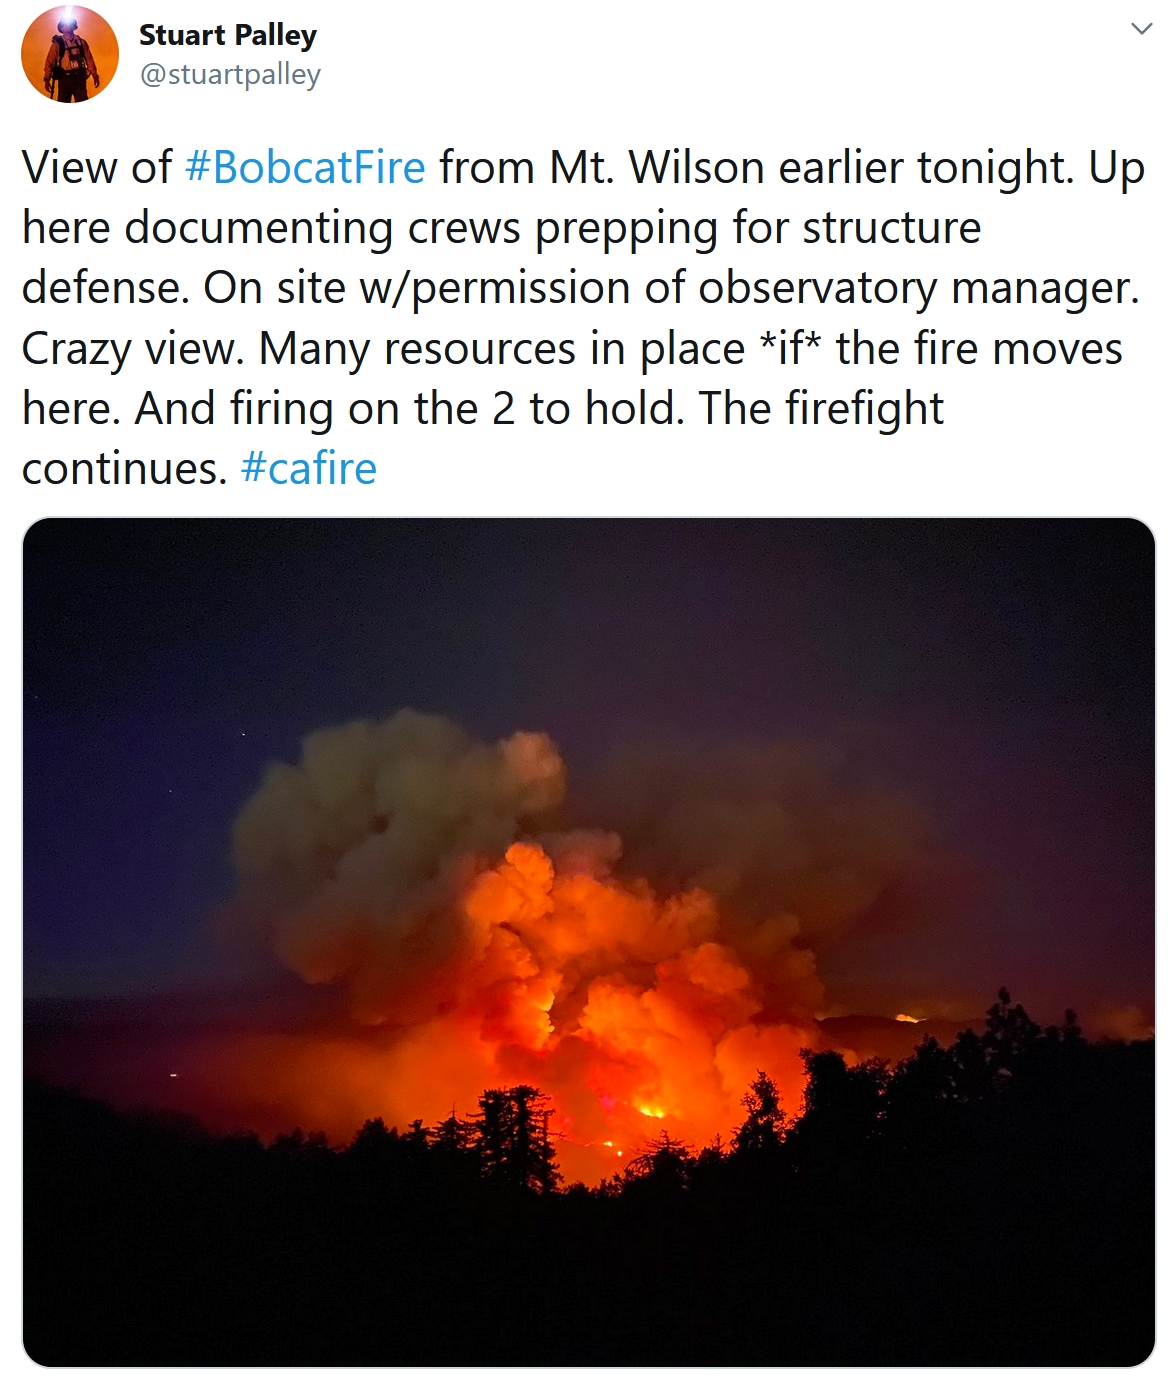
The Limits of “Forest Management”. Can we do more to clear out brush and dead trees, less fuel to combust during a mega-fire? Absolutely. But other factors are in play, according to a story at The Washington Post: “…The scale of this year’s fires have horrified even those who saw them coming. As of Tuesday, 3.2 million acres in California have been incinerated — almost double the previous record of 1.9 million, set in 2018. In Oregon, blazes have erupted in parts of the wet Western Cascades that have not burned in years. On a single day last week, red-flag warnings on fire weather stretched along the entire West Coast from the U.S. border with Mexico to Canada. “It really is a shocking escalation,” said Daniel Swain, a climate scientist at the University of California at Los Angeles. “Characterizing it as a phase change, a new era of megafire — as dramatic as that sounds, ultimately I think it’s accurate…”
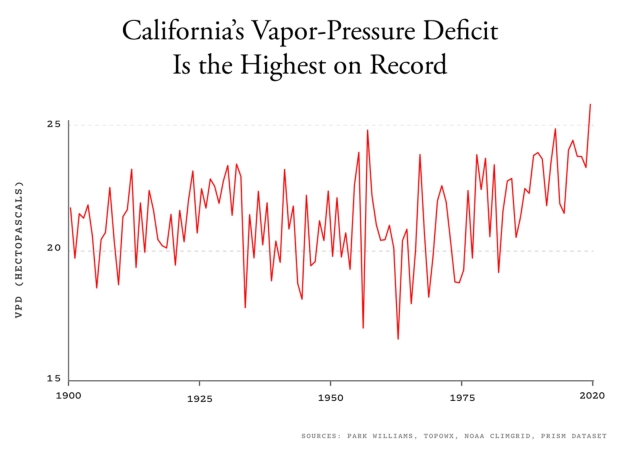
The Most Important Number for the West’s Hideous Fire Season. I did not know this; more analysis from The Atlantic: “...The vapor-pressure deficit indexes two other measurements: the air temperature and the relative humidity. Both measurements affect the air’s sponginess. Hotter air is more likely to bump water into a gas state, while drier air can hold more water vapor overall. The vapor-pressure deficit measures the overlap. “It’s the difference between the amount of water vapor that’s in the air and the amount of water vapor that the air can possibly hold,” Williams said. When the vapor-pressure deficit is high, it means the atmosphere has become an immense, six-mile-high sponge. The arid air will induce water to evaporate from wherever it’s hiding—the soil, the wooden boards of houses, the limbs and leaves of trees and underbrush...”
Graphic credit: “The vapor-pressure deficit in August in California, as calculated by Park Williams.”
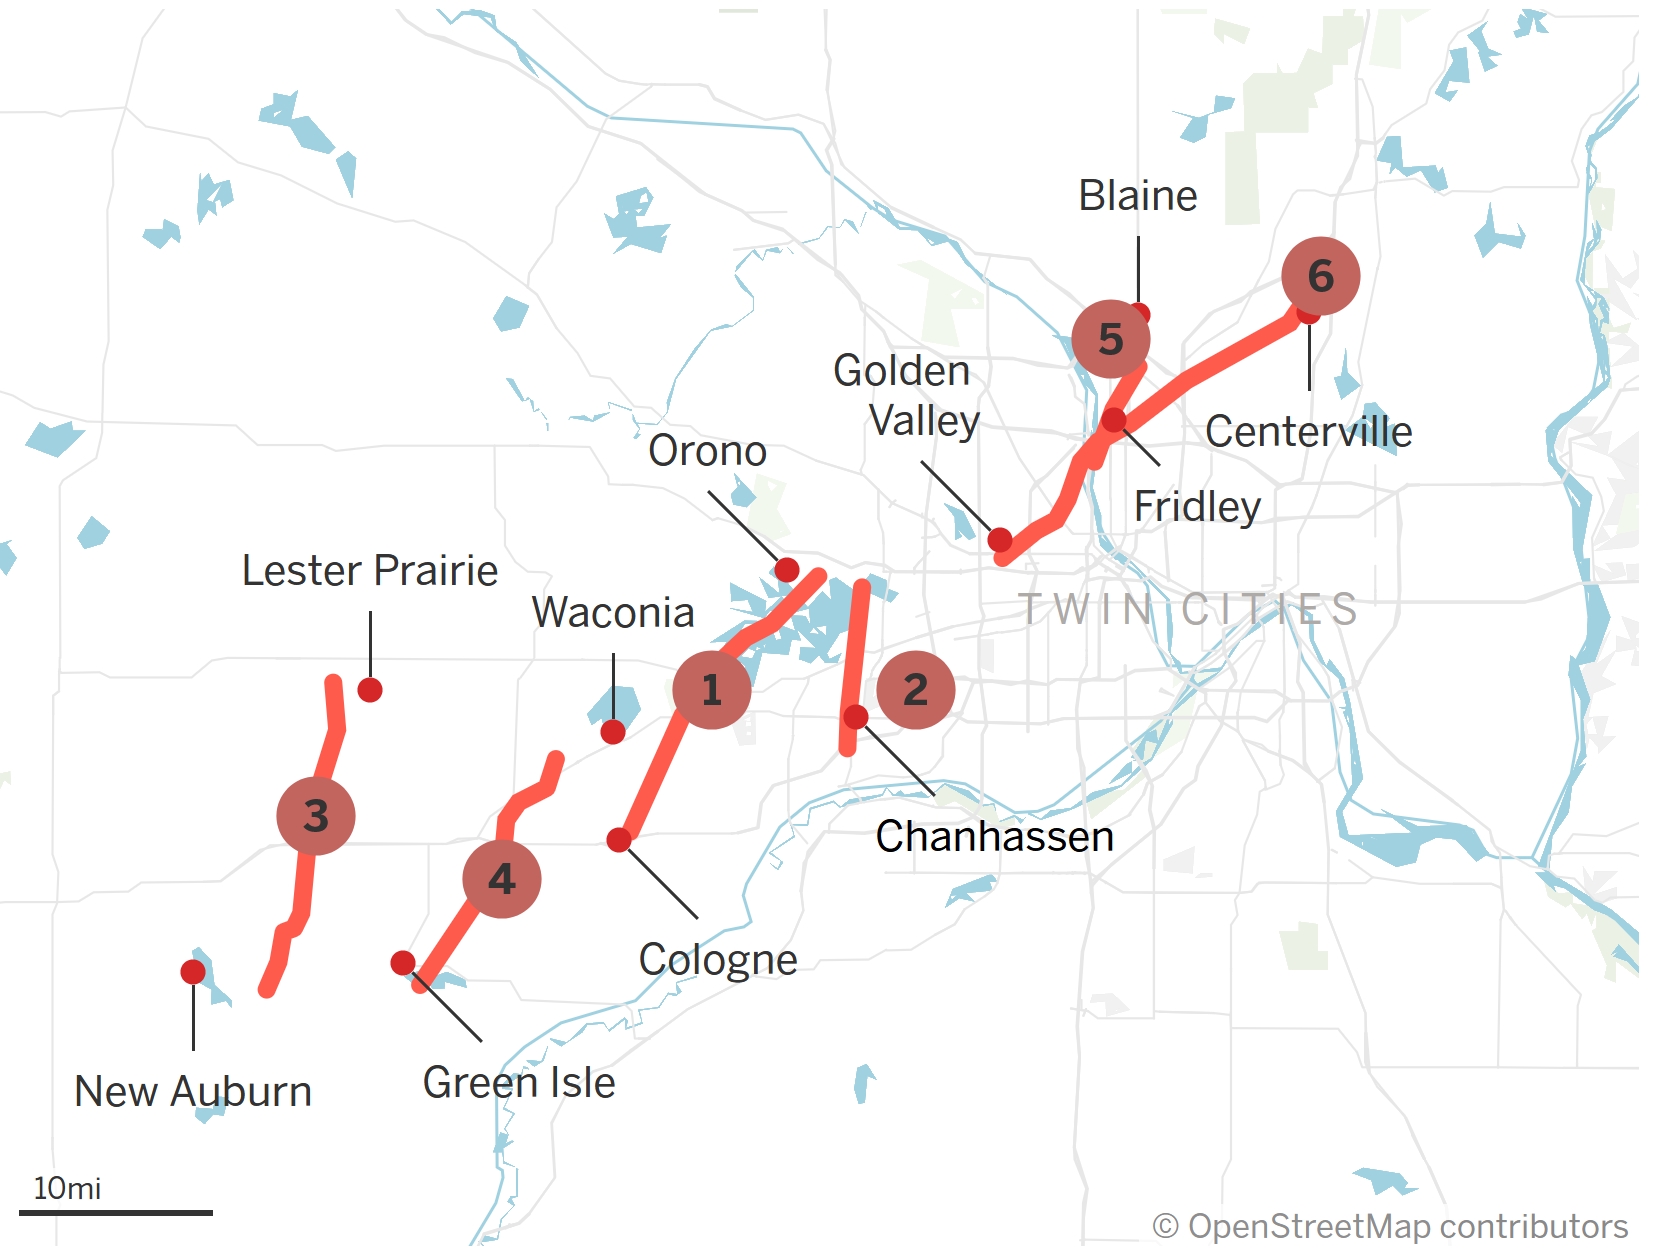
The Most Destructive Tornado in Minnesota History? Star Tribune follows up on a very good question: “…National Weather Service meteorologist Todd Krause noted that those tornadoes of a century ago tended to be more deadly because warning systems were rudimentary. Finally, if we consider property damage, the 1965 outbreak was the worst. Because it struck densely populated areas, it caused tens of millions of dollars in damage within a few hours. Some larger tornado systems may have caused more physical destruction, but fewer homes were lost because they took place in rural areas. The 1992 tornado system that hit Chandler, for example, spawned 27 total tornadoes. Even more were recorded on June 17, 2010, when 48 twisters walloped 22 counties, from Wadena to Albert Lea…”
Map credit:

“The California Compromise”. Fewer people are California-dreaming these days, due to an accumulation of disasters. The Washington Post (paywall) reports: “…This is the latest iteration of the California Dream, a Gold Rush-era slogan meant to capture the hopeful migration of an old nation to a new, rich West. For generations, the tacit agreement for California residents resembled a kind of too-good-to-be-true deal. Live in the lovely if often drought-plagued Sierra, or beneath the beachfront Pacific Coast cliffs, and work in an economy constantly reinventing itself, from Hollywood to the farms of the San Joaquin to Silicon Valley. But for many of the state’s 40 million residents, the California Dream has become the California Compromise, one increasingly challenging to justify, with a rapidly changing climate, a thumb-on-the-scales economy, high taxes and a pandemic that has led to more cases of the novel coronavirus than any other state...”
File image: Paul Douglas.

How We Survive the Winter. A story at The Atlantic helps to set our expectations, and why the worst of the virus may be yet to come: “…Viruses travel differently in air of different temperatures and humidity levels. In typical summer weather, the microscopic liquid particles that shoot out of our mouths don’t travel as efficiently as they do in dry winter air. Cold weather also drives us inside, where air recirculates. “As things get colder, activities and people will start moving indoors, and unfortunately that’s going to increase transmission risk, and the risk of super-spreading events,” Tom Inglesby, the director of the Center for Health Security at Johns Hopkins, told me. The public-health directives that have allowed many businesses to reopen in recent months—by opening windows and doing as much as possible outdoors—will no longer be feasible in regions where temperatures plunge as the days grow short…”
File image: CDC.
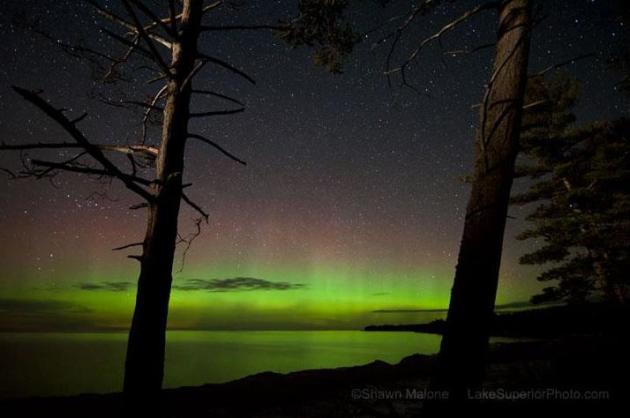
Boundary Waters Named “Dark Sky Sanctuary”. Star Tribune has the good news: “...An international association recently certified the Boundary Waters as the world’s 13th dark sky sanctuary, a title given to land that has “an exceptional or distinguished quality of starry nights and a nocturnal environment that is protected for its scientific, natural, or educational value, its cultural heritage and/or public enjoyment.” Other locations given this status by the International Dark-Sky Association include New Zealand’s Great Barrier Island and Utah’s Rainbow Bridge National Monument...”
File photo credit: Shawn Malone.
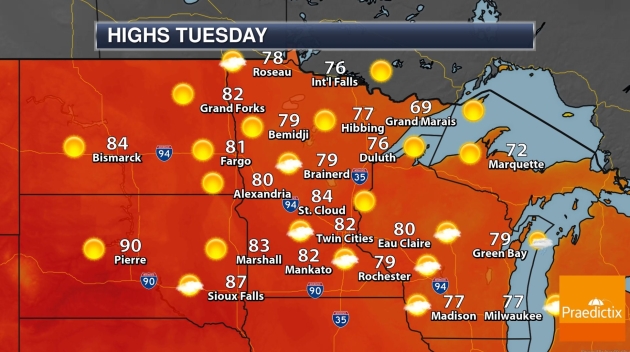
TUESDAY: Warm, smoky sunshine. Winds: S 7-12. High: 82
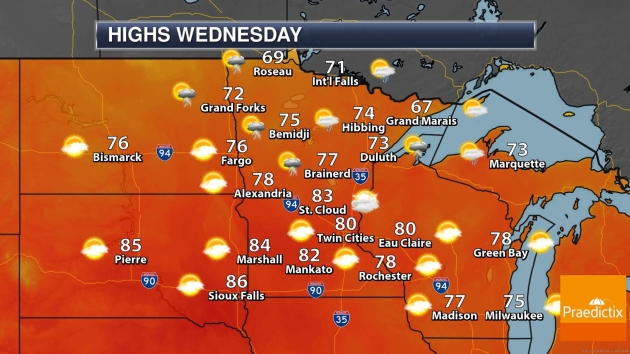
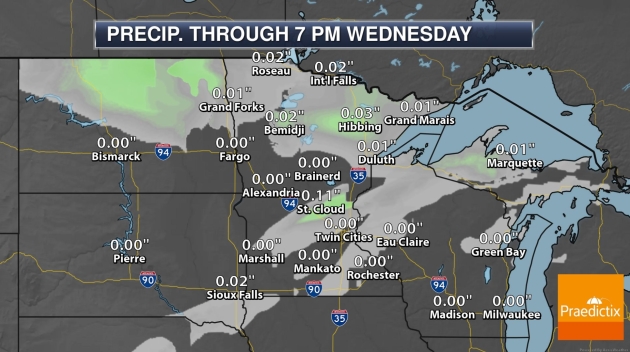
WEDNESDAY: Hazy sunshine, late night T-storms? Winds: SW 10-15. Wake-up: 60. High: 81
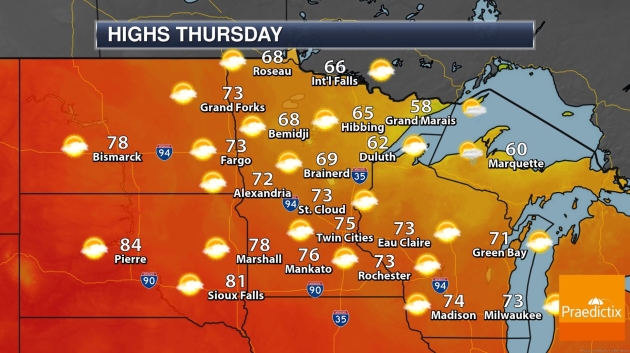
THURSDAY: Cooler with a few showers. Winds: NW 8-13. Wake-up: 61. High: 72
FRIDAY: Sunny, warm and windy. Winds: S 15-25. Wake-up: 62. High: near 80
SATURDAY: Showery rains, cooler breeze. Winds: W 15-25. Wake-up: 59. High: 71
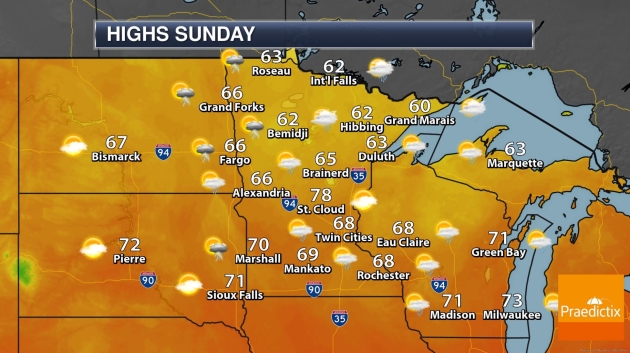
SUNDAY: Mostly cloudy, a drier day. Winds: W 10-15. Wake-up: 55. High: 67
MONDAY: Blustery with more rain showers. Winds: NW 15-35+. Wake-up: 51. High: near 60
Climate Stories…
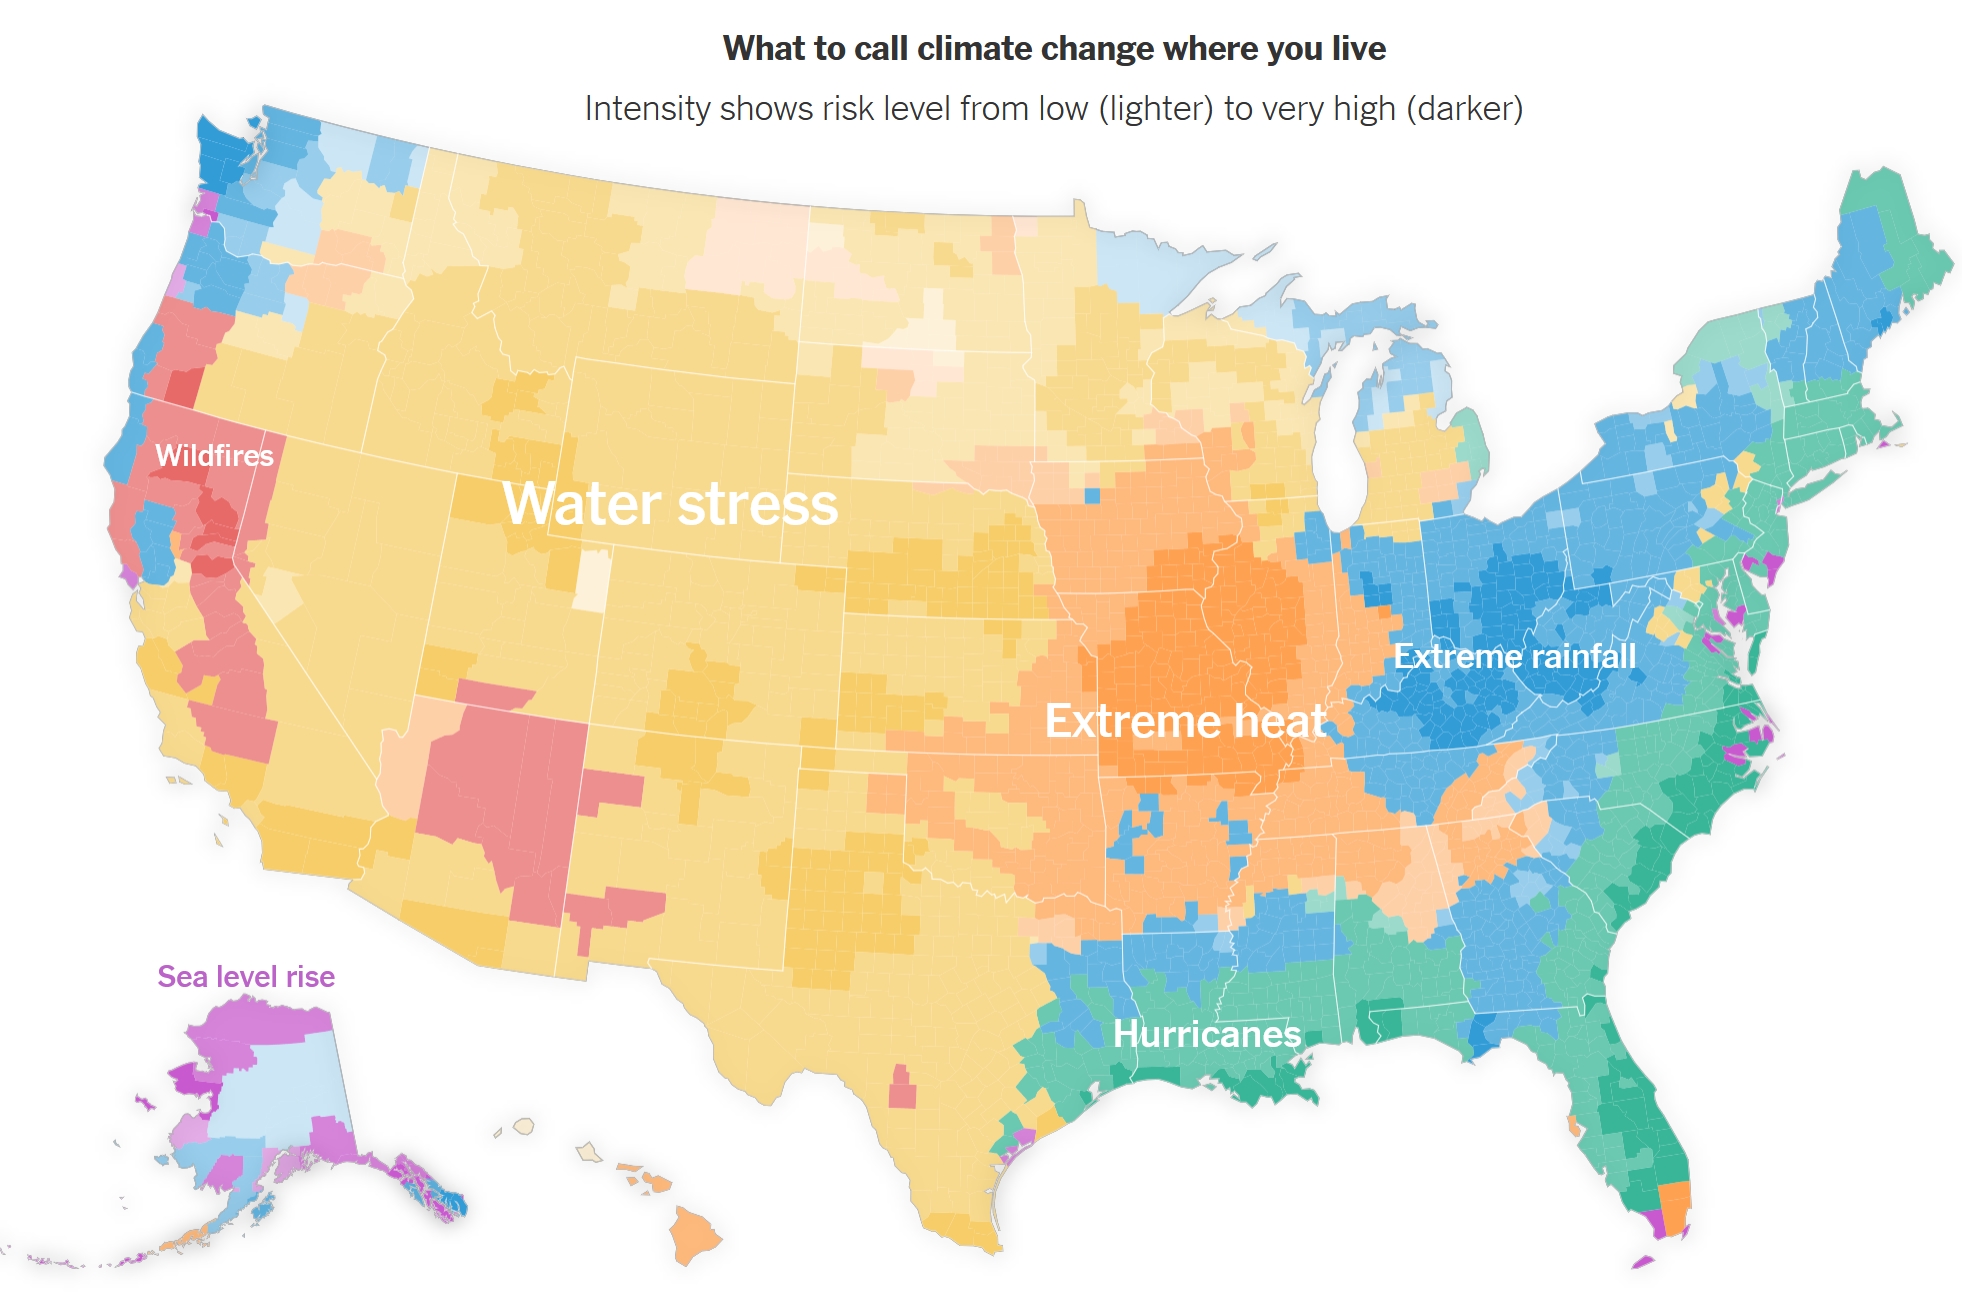
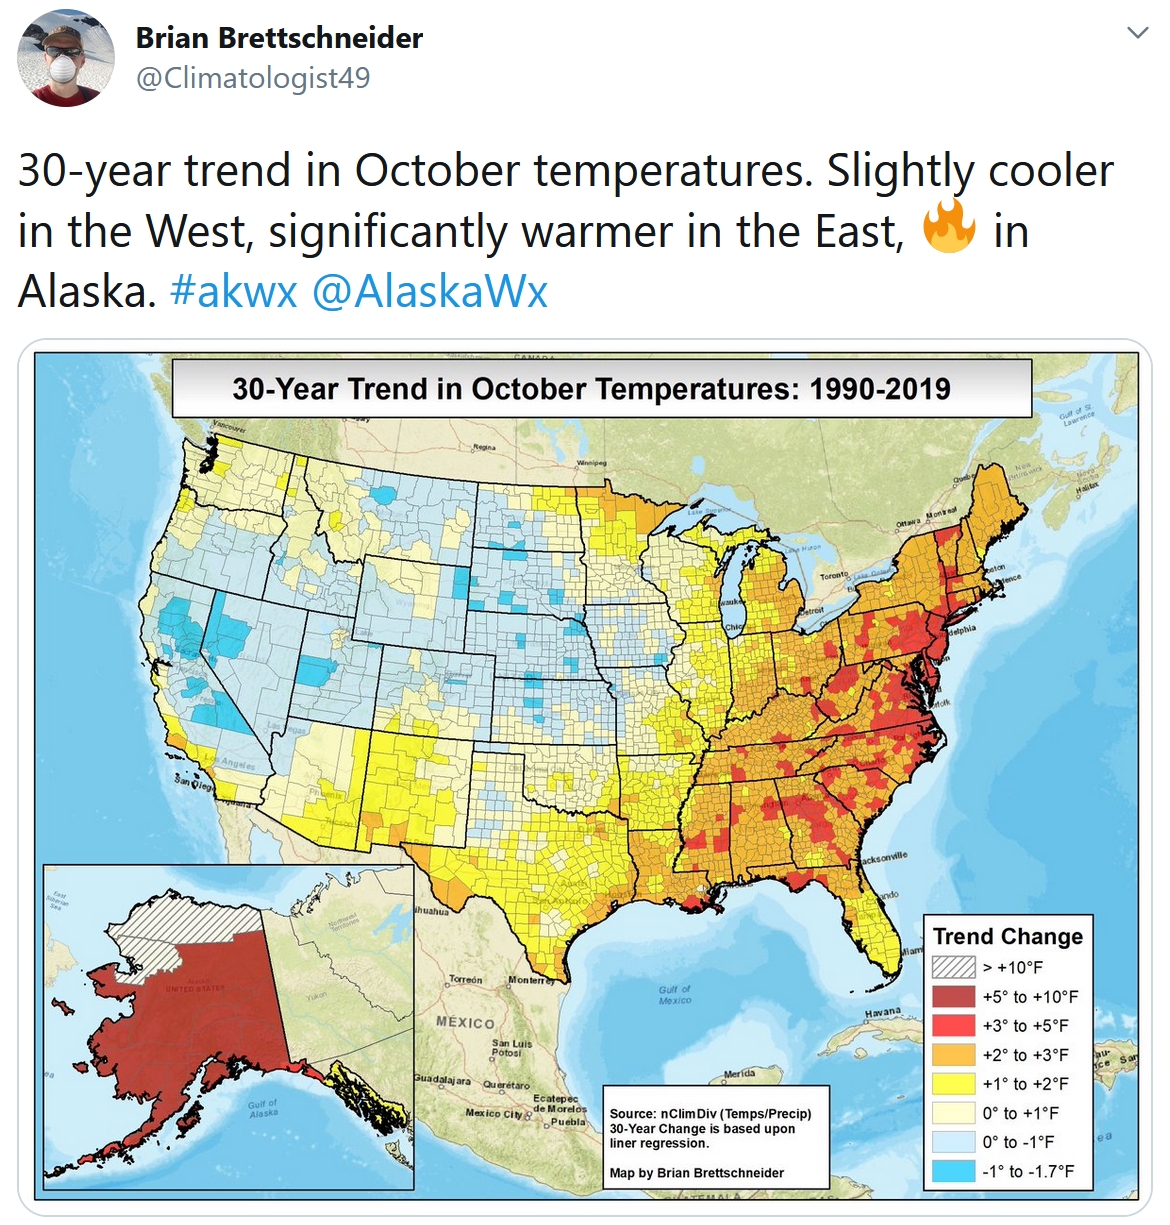
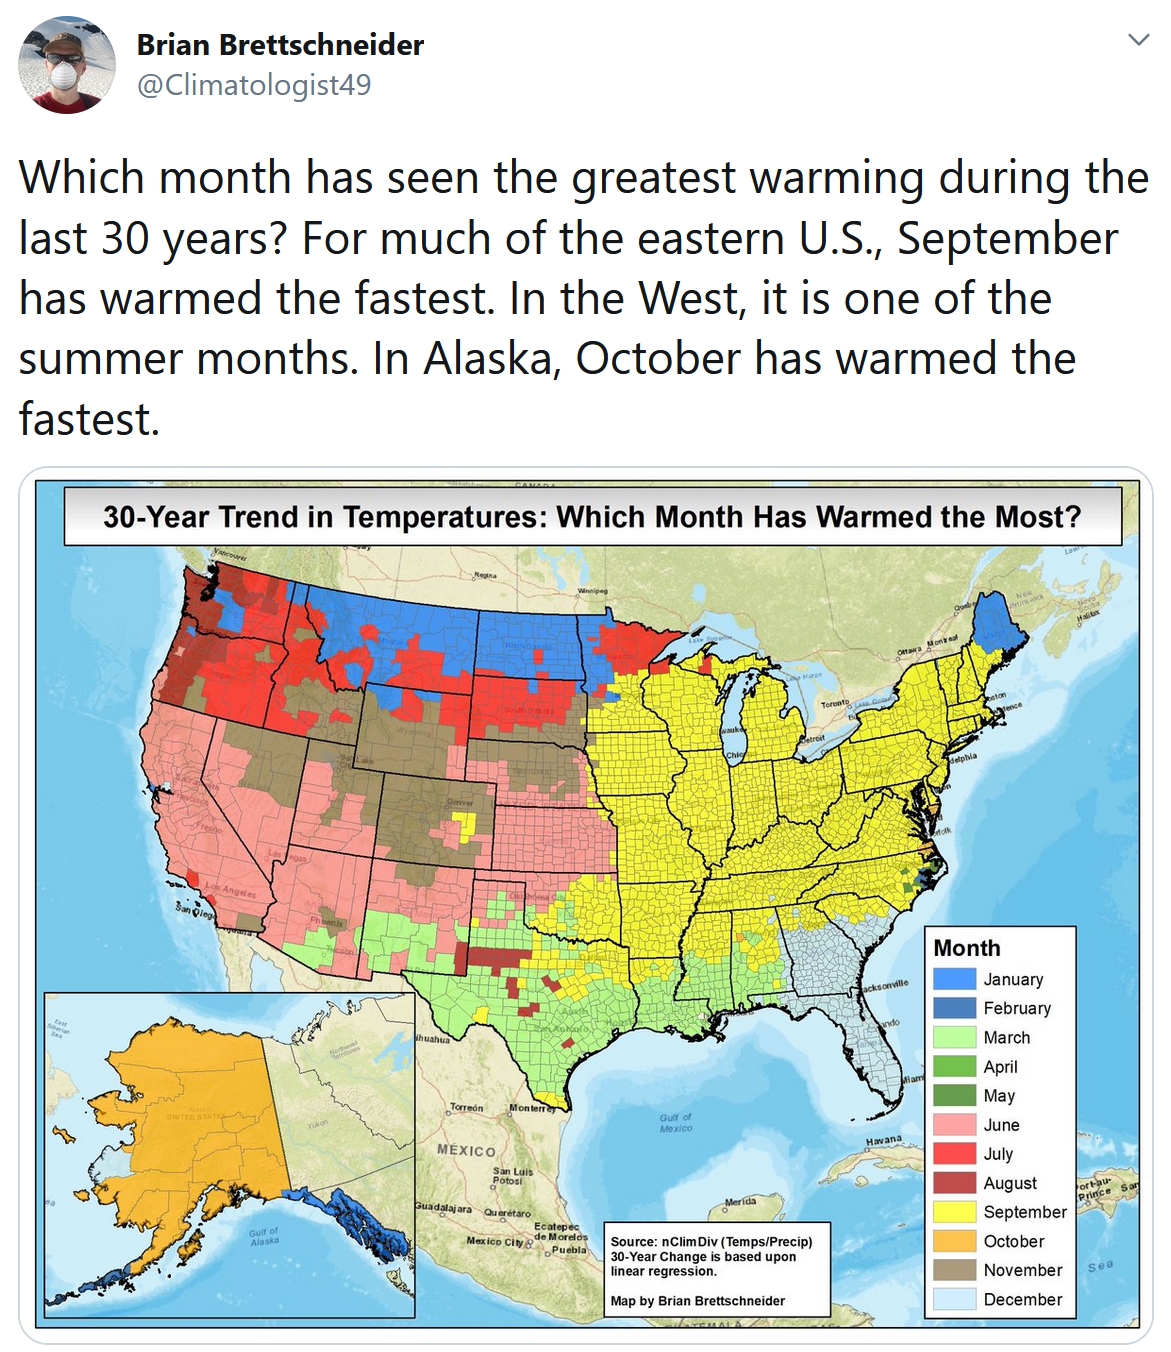
Every Place Has It’s Own Climate Risks. What Is It Where You Live? It turns out semantics matter. Here’s an excerpt from an Op-Ed at The New York Times (paywall): “…The solution may be found in research showing that addressing climate change in emotional and personal terms is far more persuasive. “There is a lot of evidence behind the idea that personalizing climate change and helping people understand the local impacts are more important than talking about how it’s influencing melting glaciers or talking about wildfires when you live in Ohio,” said Jennifer Marlon, a research scientist and lecturer at Yale. The idea of a climate rebranding gained new attention this week after Gov. Jay Inslee of Washington told reporters: “These are not just wildfires. They are climate fires…”
Map credit: “Note: “Water stress” reflects the change in drought-like conditions as well as water demand. The methodology does not consider distant water supply, so in counties where that may play a larger role, we have selected the second-highest climate risk. Risk levels reflect climate impacts from today to 2040. The “wildfire” label applies to counties where at least part of the region contains the highest risk rating in Four Twenty Seven’s data. Other terms are assigned using the highest percentile scores among the remaining climate risks.” Source: Four Twenty Seven.
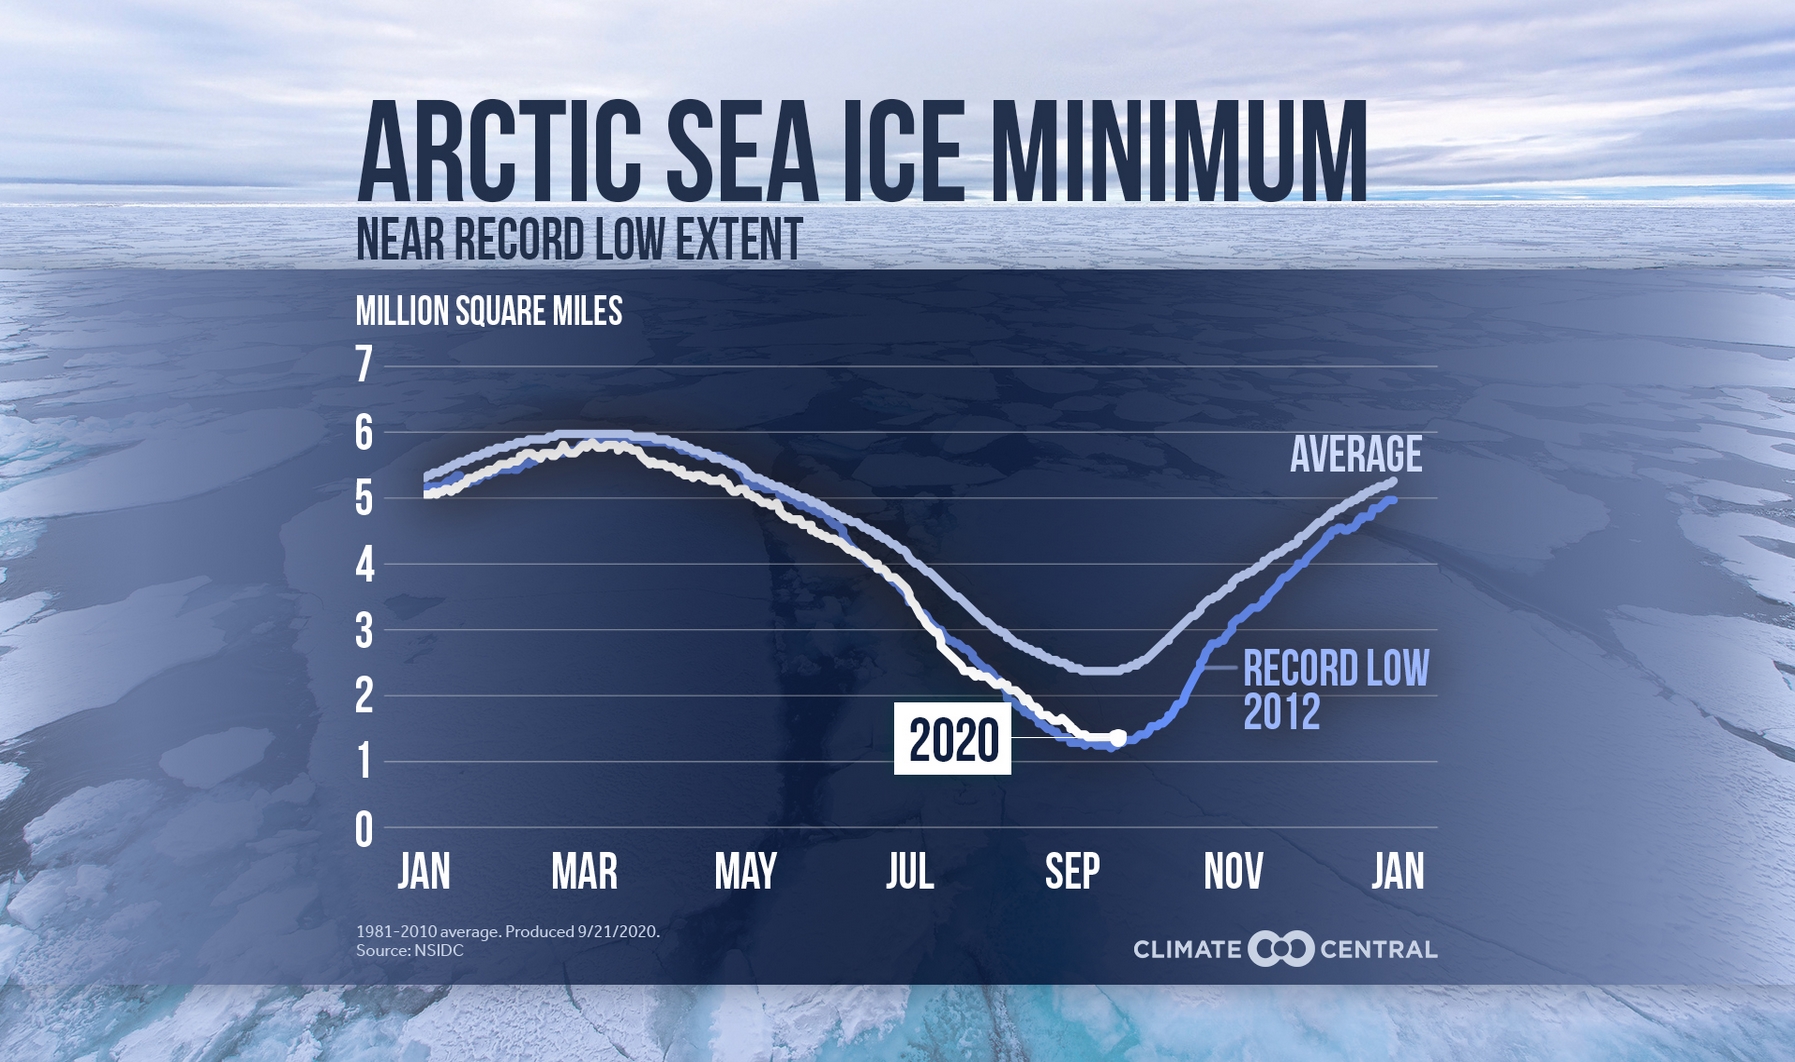
Arctic Sea Ice. An update from Climate Central: “Arctic sea ice likely reached its minimum extent for the year, 1.44 million square miles, on September 15. The 2020 minimum is the second lowest in the nearly 42-year satellite record according to the National Snow and Ice Data Center (NSIDC). That extent is about 46% of the area of the 48 contiguous states. A Siberian heat wave began this year’s Arctic sea ice melt season early, and with Arctic temperatures 14°F to 18°F warmer than average, the ice kept melting. Arctic ice loss is leading to a reinforcing heat spiral. When ice melts and exposes the open ocean, the darker ocean surface absorbs more heat, which then leads to more ice loss, continuing the feedback loop. This contributes to the Arctic regions warming twice as fast as the rest of the planet...”
Meet the Man Who Told Trump Climate Change is Real. Speaking truth to power? Here’s an excerpt from Science AAAS: “…Crowfoot, 47, runs California’s Natural Resources Agency and oversees 19,000 employees and multiple agencies. His decision to challenge Trump was spontaneous. “I didn’t plan to beforehand,” Crowfoot said an interview. “I don’t know if it was instinct, or just the intellectual curiosity of actually trying to have a conversation with him on it,” he added. There were multiple points to make on the fires, Crowfoot said, but he believed “the most important conversation to engage him in was climate change.” On the president’s response—regarding climate scientists not knowing about rising temperatures—Crowfoot said he felt “disappointed but perhaps not surprised.” The discussion marked a rare occasion on which Trump received pointed—and accurate—information about climate change...”
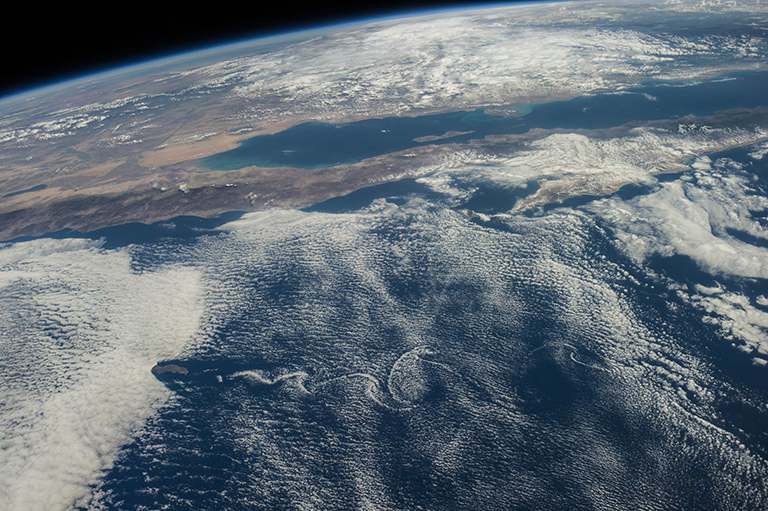
File photo of Baja California: NASA.
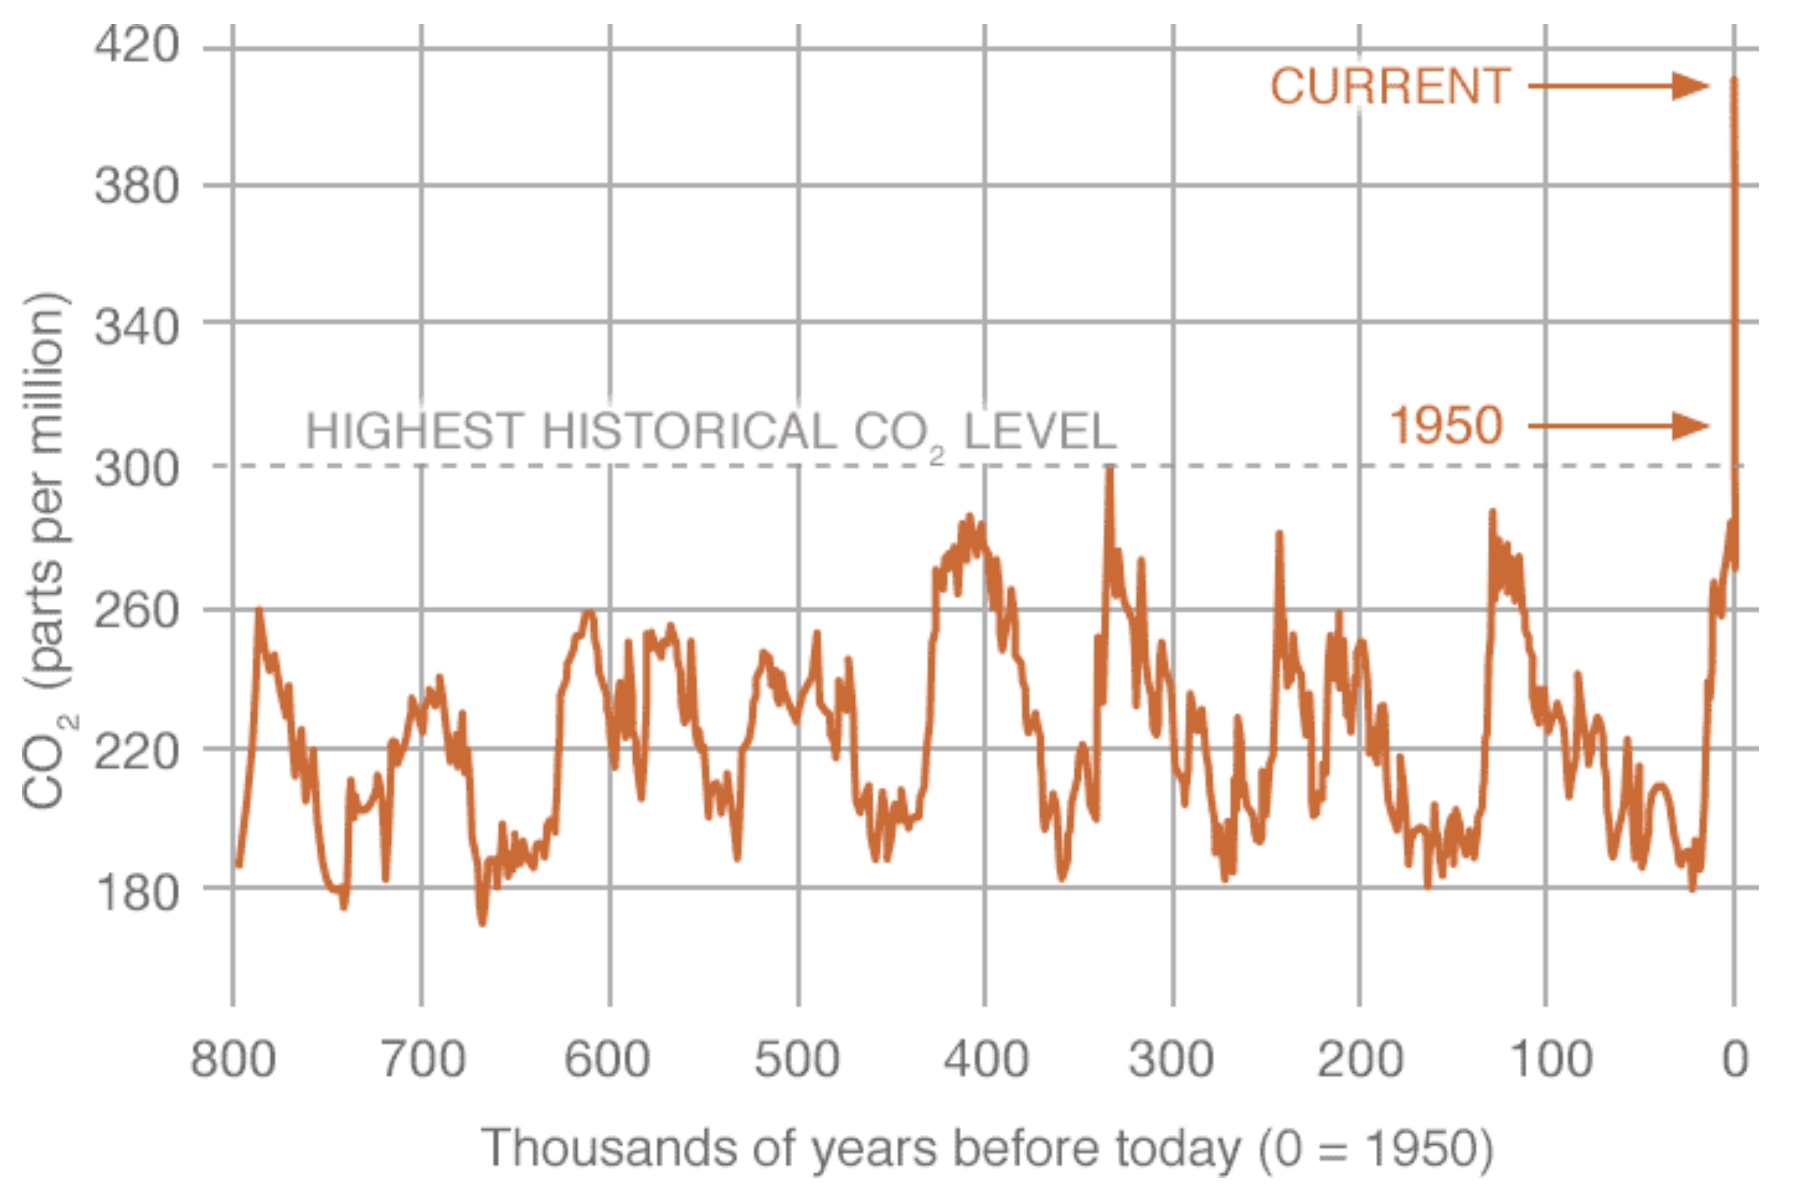
The Carbon Footprint Sham. When is a corporation’s motives and tactics appropriate and authentic vs. a well-oiled case of greenwashing? Here’s an excerpt from Mashable: “…Doyle concludes BP sought to explain what a carbon footprint is “in a way which assigns responsibility for climate impact to the individual, while BP registers its own concerns by appearing already to be doing something about it.” Yet in a society largely powered by fossil fuels, even someone without a car, home, or job will still carry a sizable carbon footprint. A few years after BP began promoting the “carbon footprint,” MIT researchers calculated the carbon emissions for “a homeless person who ate in soup kitchens and slept in homeless shelters” in the U.S. That destitute individual will still indirectly emit some 8.5 tons of carbon dioxide each year...”
Graphic credit: CO2 levels for the last 800,000 years courtesy of NASA.

Geoengineering is the Only Solution to Our Climate Calamities. God help us if it gets to this point, because really, what could possibly go wrong? Here’s an excerpt of an Op-Ed at WIRED.com (paywall): “…The environmental “Manhattan Project” we need would also require pooling together the innovation and resources of Bill Gates, who has invested billions in concentrated solar power and fusion reactors, Elon Musk, who has nearly single-handedly created the supply and the demand for a commercially viable market for electric vehicles, and potentially Jeff Bezos, whose Earth Fund is directing at least $10 billion towards climate initiatives, as well as other tech visionaries and the research organizations they support. Hopefully, today’s climate protagonists are already working to launch a range of geoengineering schemes, even if they have to do so in secret, shielded from climate-change-denying politicians and interest groups masquerading in the name of democratic accountability. Governments and environmental advocates are right to demand that all organizations involved in geoengineering transparently disclose their funding, objectives, and results on sites such as Geoengineering Monitor...”
File image: NASA.
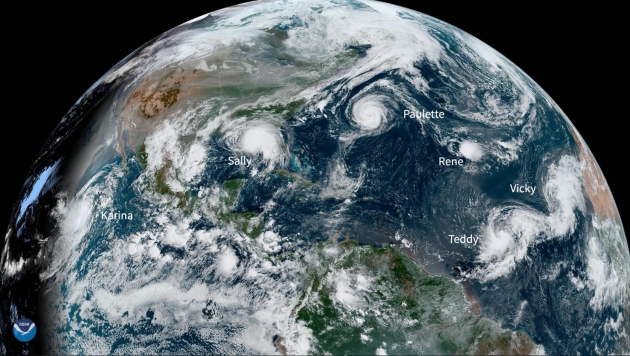
Why Hurricane Sally is Moving So Slowly – And Delivering Epic Rainfall. Much like Harvey and Florence, Sally’s extremely slow forward movement prolonged heavy rains along the Gulf Coast, where over 30″ was reported in some locations. National Geographic has more details: “…Emerging research is showing that the climate crisis will make storms move more slowly and higher temperatures will allow them to carry more water. One paper published in 2018 showed that hurricanes around the world were already moving about 10 percent slower on average than they did before 1950. Warmer temperatures also make hurricanes rainier. Warm air is able to hold more water vapor, and historic rainfall like Hurricane Harvey produced in Houston, Texas, has been linked to climate change...”
Image credit: “On Monday morning, a NOAA satellite identified five storm systems in the Atlantic and one in the Pacific Ocean. It was the first time since 1971 that five named storms were in the Atlantic Basin at the same time.” Photograph courtesy NOAA.
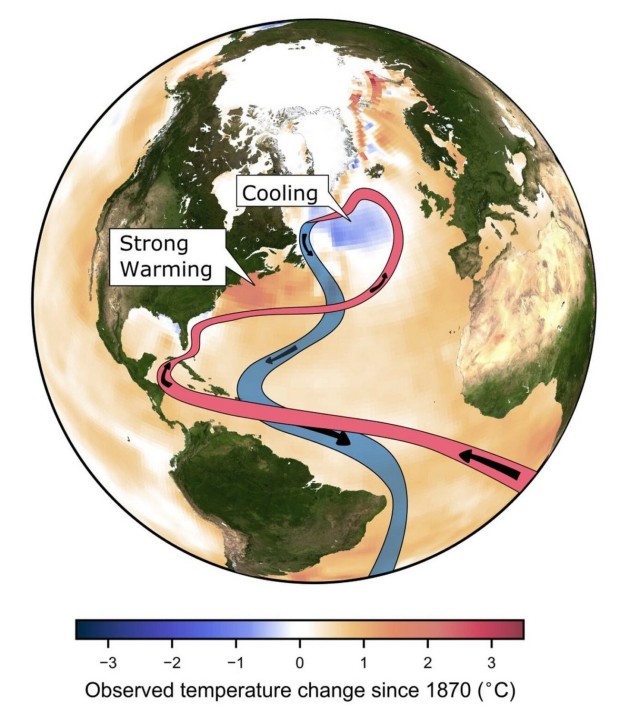
New Studies Confirm Weakening of the Gulf Stream Circulation (AMOC). Here’s a timely post from RealClimate: “Many of the earlier predictions of climate research have now become reality. The world is getting warmer, sea levels are rising faster and faster, and more frequent heat waves, extreme rainfall, devastating wildfires and more severe tropical storms are affecting many millions of people. Now there is growing evidence that another climate forecast is already coming true: the Gulf Stream system in the Atlantic is apparently weakening, with consequences for Europe too. The gigantic overturning circulation of the Atlantic water (dubbed AMOC) moves almost 20 million cubic meters of water per second – almost a hundred times the Amazon flow. Warm surface water flows to the north and returns to the south as a cold deep current. This means an enormous heat transport – more than a million gigawatts, almost one hundred times the energy consumption of mankind. This heat is released into the air in the northern Atlantic and has a lasting effect on our climate…”
Map credit: “Diagram of the Gulf Stream system with the warm surface current and the cold deep current. The actual Gulf Stream off the US coast is a part of this more comprehensive circulation system. The color shading shows the measured temperature trend since the late 19th century. This diagram is based on Caesar et al., Nature 2018 and first appeared in the Washington Post.”

Business Roundtable Endorses Market-Based Climate Policy. POLITICO reports: “The Business Roundtable, a major trade association that includes the heads of some of the largest and most influential companies in the U.S. as members, is endorsing a “market-based mechanism” as part of a plan to sharply curb greenhouse gas emissions that cause climate change, The move, which was first reported by POLITICO on Tuesday, throws the lobbying voice of those executives from companies with $7 trillion in annual revenues behind efforts to combat climate change, reflecting a stark division between the business community and the Trump administration...”