No doubt 2019 has been a historic year in terms of flooding. Following flooding from the Spring’s snow thaw, repeated rounds of intense rain/thunderstorm events these last few weeks have pushed things to a whole new level. Relentless Spring rain has resulted in record-smashing river levels and widespread, catastrophic flooding. According to the National Weather Service, the flooding along the Mississippi River is the longest-lasting since the “Great Flood” of 1927. Recent rounds of strong to severe thunderstorms that brought tornadoes have also resulted in historic flooding for Oklahoma and Arkansas.

Arkansas River Flooding in May 2019 at the Clark Wetlands showing turtles seeking refuge on roof of pavilion via United States Army Corps of Engineers.

Arkansas River Flooding at the Clark Wetlands. Credit: US Army Corps | Little Rock District.


Catastrophic Flooding in Webbers Falls, Oklahoma in May 2019 showing homes and farms under water.

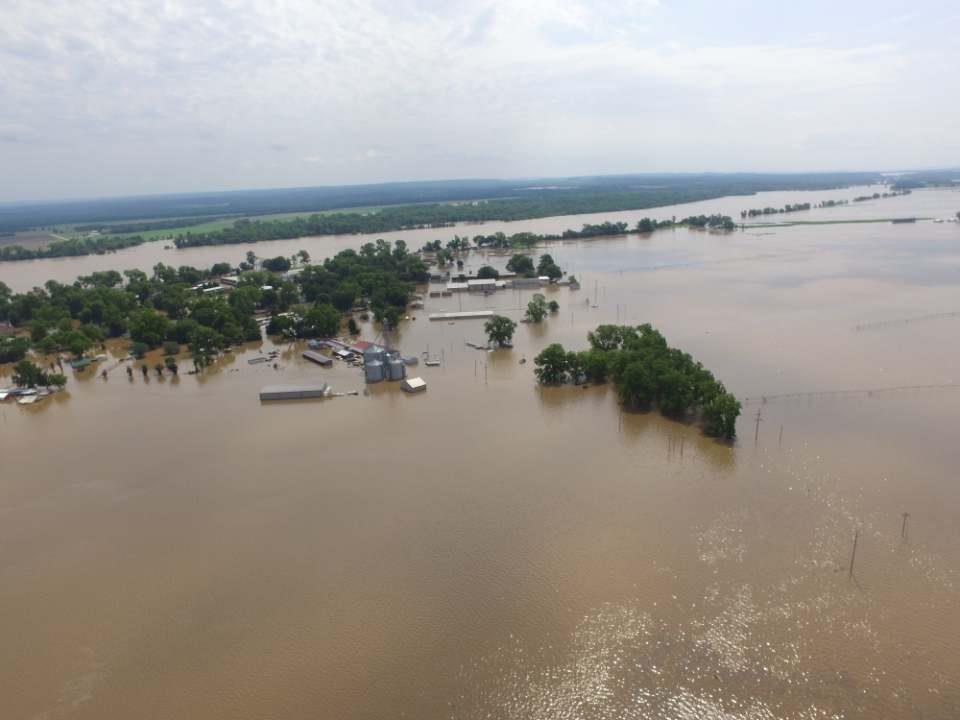
Flooding in Webbers Falls, Oklahoma. May 2019. Credit: Town of Webbers Falls.

In today’s Weather Graphics Spotlight, we’re featuring an assortment of our flood-related graphics. At Praedictix, we generate thousands of weather graphics a day for our clients and our own internal use. Every graphic can be uniquely customized to fit our clients’ needs and are delivered automatically via FTP, though other delivery options are available. Furthermore, we allow our clients to push their brand by use of watermarks and logo overlays. We’re not limited to severe weather graphics! A menu of our current graphics offerings can be found here. Don’t see what you’re looking for? Be sure to ask us about what you are needing!

Flood Graphics

Flood weather graphics showing flood warnings watches and advisories including flash flooding in Central Plains from April 30, 2019.

Flood Watches, Warnings, and Advisories in April 2019.


Flood weather graphic of river observations at flood stage in Sioux Falls, South Dakota in May 2019.

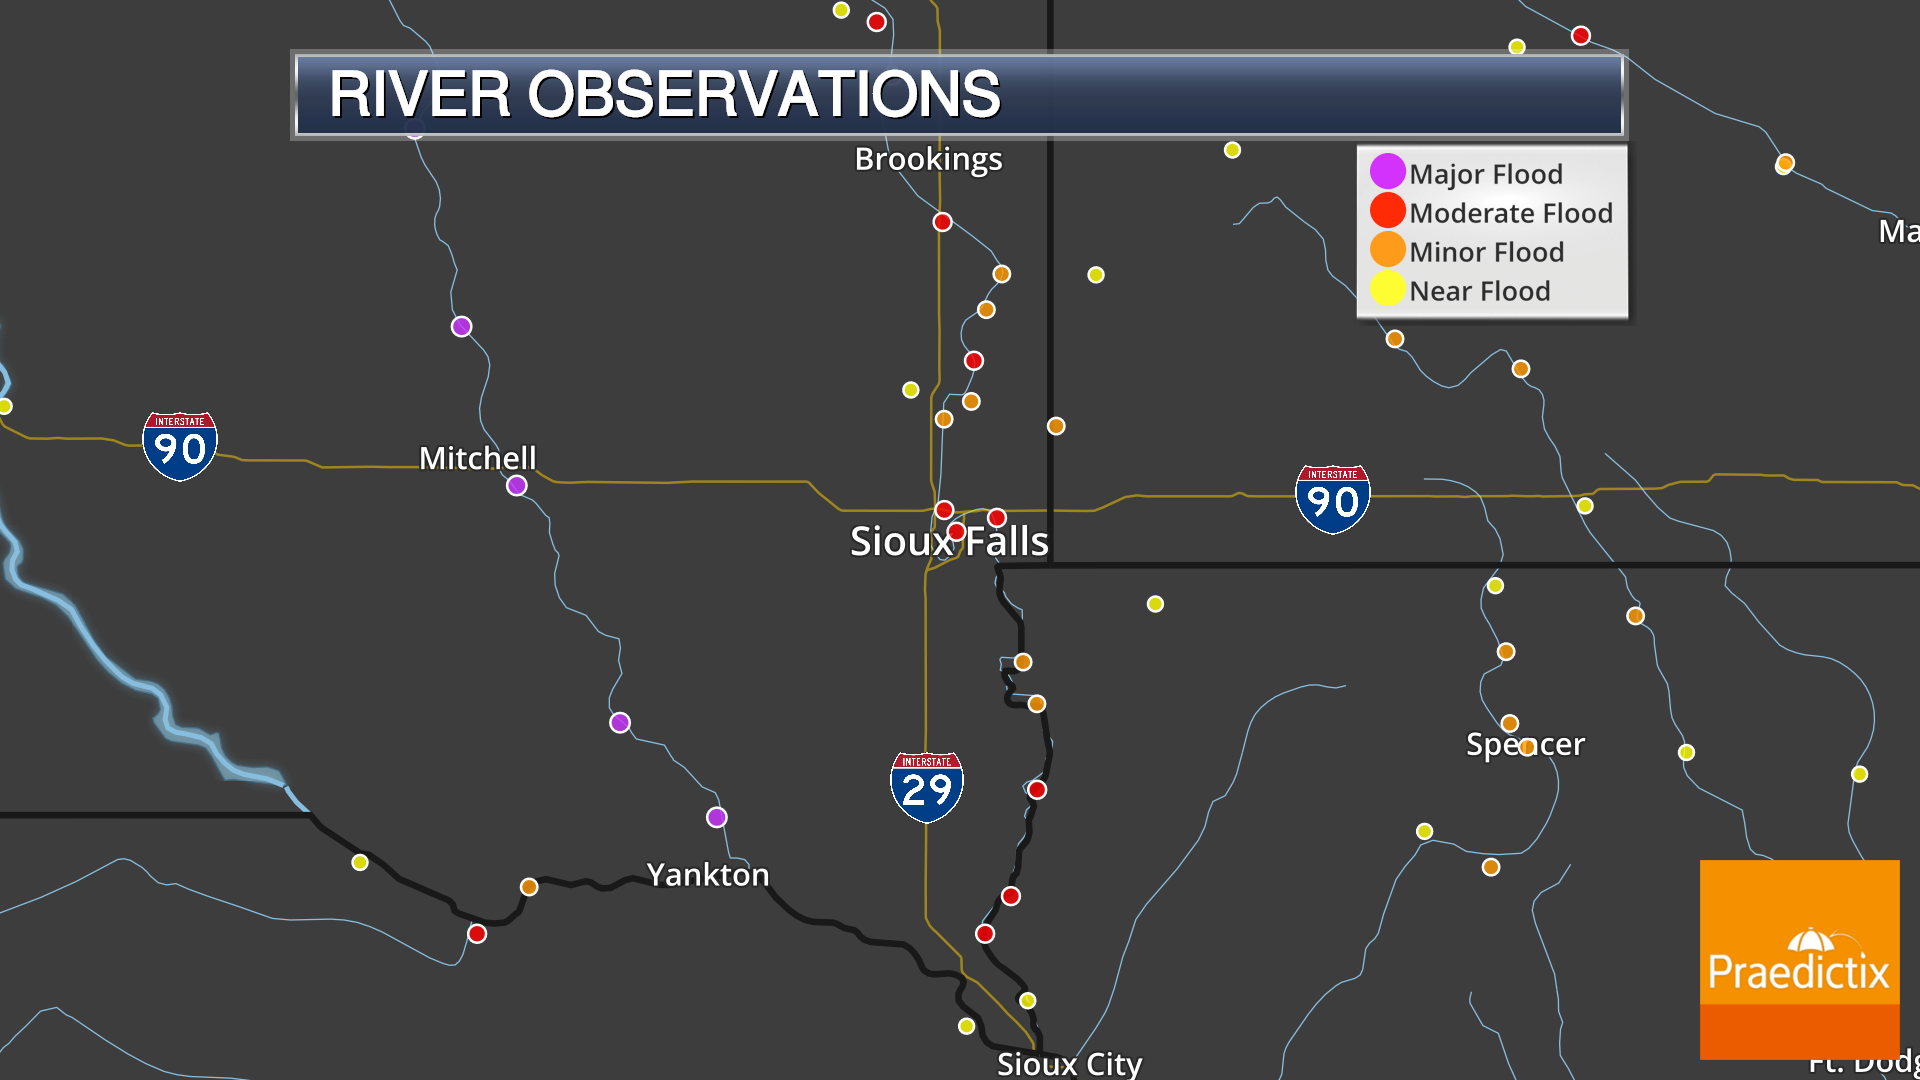
River observations in the Sioux Falls area of South Dakota. May 2019.


Flood weather graphic of AHPS hydrograph of Mississippi River at Rock Island, Illinois in the Quad cities showing near-record flood stage.

Hydrograph panel graphic of Mississippi River at Rock Island, Illinois. Early May 2019.


Weather graphic showing flood stage river observations with flood warnings on dark map in Quad Cities Iowa and Illinois.

River Observations and Flood Warnings in the Quad Cities area. May 2019.


Rain weather graphic of forecast NDFD model rain in Texas from early May 2019 showing over a half a foot of rain in Houston.

Forecast 3-day Rainfall in Texas in May 2019.


Weather graphic of radar and flood warnings in Pennsylvania with legend on May 29, 2019.

Radar and flood warnings in Pennsylvania. May 2019.


Weather map showing past 30 day rainfall in the United States with legend. AHPS.

Past 30 Day Rainfall (AHPS data). May 2019.


Weather map of departure from average 30 day rain in United States with legend.

Departure from Average of 30-day Rainfall in inches (AHPS data). May 2019.


weather graphic showing percentage departure from average of 30 day rain in the United States with legend on dark map.

Percentage departure from average of past 30-day rainfall (AHPS data). May 2019.


Weather graphic of Climate Prediction Center long-term precipitation outlook with legend on dark map.

6 to 10 Day Precipitation Outlook (CPC data).

How do our clients use our graphics?

Our graphics are used in many different ways ranging from broadcast television to websites and social media. Our high-resolution weather graphics and weather maps are offered in all shapes and sizes, for any geographical location, at very affordable prices. We have multiple options for base-maps and a full suite of weather data layers to choose from. With the ability to include your own branding and/or sponsor overlays, monetizing weather graphics has never been easier. Want to learn more? We’d love to hear from you!

Product Interest

9 + 9 =